Asus 2015 Annual Report Download - page 110
Download and view the complete annual report
Please find page 110 of the 2015 Asus annual report below. You can navigate through the pages in the report by either clicking on the pages listed below, or by using the keyword search tool below to find specific information within the annual report.-
 1
1 -
2
-
3
-
4
-
5
-
6
-
7
-
8
-
9
-
10
-
11
-
12
-
13
-
14
-
15
-
16
-
17
-
18
-
19
-
20
-
21
-
22
-
23
-
24
-
25
-
26
-
27
-
28
-
29
-
30
-
31
-
32
-
33
-
34
-
35
-
36
-
37
-
38
-
39
-
40
-
41
-
42
-
43
-
44
-
45
-
46
-
47
-
48
-
49
-
50
-
51
-
52
-
53
-
54
-
55
-
56
-
57
-
58
-
59
-
60
-
61
-
62
-
63
-
64
-
65
-
66
-
67
-
68
-
69
-
70
-
71
-
72
-
73
-
74
-
75
-
76
-
77
-
78
-
79
-
80
-
81
-
82
-
83
-
84
-
85
-
86
-
87
-
88
-
89
-
90
-
91
-
92
-
93
-
94
-
95
-
96
-
97
-
98
-
99
-
 100
100 -
 101
101 -
 102
102 -
 103
103 -
 104
104 -
 105
105 -
 106
106 -
 107
107 -
 108
108 -
 109
109 -
 110
110 -
 111
111 -
 112
112 -
 113
113 -
 114
114 -
 115
115 -
 116
116 -
 117
117 -
 118
118 -
 119
119 -
 120
120 -
121
-
122
-
123
-
124
-
125
-
126
-
127
-
128
-
129
-
130
-
131
-
132
-
133
-
134
-
135
-
136
-
137
-
138
-
139
-
140
-
141
-
142
-
143
-
144
-
145
-
146
-
147
-
148
-
149
-
150
-
151
-
152
-
153
-
154
-
155
-
156
-
157
-
158
-
159
-
160
-
161
-
162
-
163
-
164
-
165
-
166
-
167
-
168
-
169
-
170
-
171
-
172
-
173
-
174
-
175
-
176
-
177
-
178
-
179
-
180
-
181
-
182
-
183
-
184
-
185
-
186
-
187
-
188
-
189
-
190
-
191
-
192
-
193
-
194
-
195
-
196
-
197
-
198
-
199
-
200
-
201
-
202
-
203
-
204
-
205
-
206
-
207
-
208
-
209
-
210
-
211
-
212
-
213
-
214
-
215
-
216
-
217
-
218
-
219
-
220
-
221
-
222
-
223
-
224
-
225
-
226
-
227
-
228
-
229
-
230
-
231
-
232
-
233
-
234
-
235
-
236
-
237
-
238
-
239
-
240
-
241
-
242
-
243
-
244
-
245
-
246
-
247
-
248
-
249
-
250
-
251
-
252
-
253
-
254
-
255
-
256
-
257
-
258
-
259
-
260
-
261
-
262
-
263
-
264
-
265
-
266
-
267
-
268
-
269
-
270
-
271
-
272
-
273
-
274
-
275
-
276
-
277
-
278
-
279
 |
 |

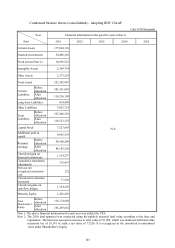
106
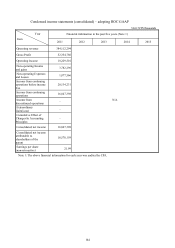
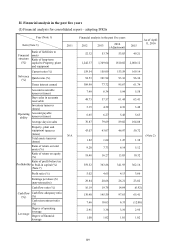
Condensed statements of comprehensive income (separate) – adopting IFRSs
Unit: NT$ thousands
Year
Item
Financial information in the past five years (Note 1) As of
April 11, 2016
2011 2012 2013 2014
(Adjustment) 2015
Operating revenue
N/A
375,118,873 358,741,099 384,234,950 377,074,468
(Note 2)
Realized gross profit 24,482,294 23,195,769 24,427,785 24,098,655
Operating Income 14,765,207 9,775,216 10,685,311 9,263,997
Non-operating Income
and Expenses 11,899,543 15,786,546 12,690,772 11,733,974
Profit before tax 26,664,750 25,561,762 23,376,083 20,997,971
Income (Losses) from
Continuing Operations
for the year
22,463,572 21,449,895 19,470,409 17,097,470
Losses from
Discontinued Operations - - - -
Profit for the year 22,463,572 21,449,895 19,470,409 17,097,470
Other comprehensive
income for the year (Net
of income tax)
(402,538) 4,376,626 23,455,604 (1,027,712)
Total comprehensive
income for the year 22,061,034 25,826,521 42,926,013 16,069,758
Earnings per share
(non-retroactive) 29.84 28.66 26.21 23.02
Note 1: The above financial information for each year was audited by CPA.
Note 2: The 2016Q1 financial statements have not yet been audited by CPA up to the date of the report printed on
April 11, 2016.