Asus 2015 Annual Report Download - page 209
Download and view the complete annual report
Please find page 209 of the 2015 Asus annual report below. You can navigate through the pages in the report by either clicking on the pages listed below, or by using the keyword search tool below to find specific information within the annual report.-
 1
1 -
2
-
3
-
4
-
5
-
6
-
7
-
8
-
9
-
10
-
11
-
12
-
13
-
14
-
15
-
16
-
17
-
18
-
19
-
20
-
21
-
22
-
23
-
24
-
25
-
26
-
27
-
28
-
29
-
30
-
31
-
32
-
33
-
34
-
35
-
36
-
37
-
38
-
39
-
40
-
41
-
42
-
43
-
44
-
45
-
46
-
47
-
48
-
49
-
50
-
51
-
52
-
53
-
54
-
55
-
56
-
57
-
58
-
59
-
60
-
61
-
62
-
63
-
64
-
65
-
66
-
67
-
68
-
69
-
70
-
71
-
72
-
73
-
74
-
75
-
76
-
77
-
78
-
79
-
80
-
81
-
82
-
83
-
84
-
85
-
86
-
87
-
88
-
89
-
90
-
91
-
92
-
93
-
94
-
95
-
96
-
97
-
98
-
99
-
100
-
101
-
102
-
103
-
104
-
105
-
106
-
107
-
108
-
109
-
110
-
111
-
112
-
113
-
114
-
115
-
116
-
117
-
118
-
119
-
120
-
121
-
122
-
123
-
124
-
125
-
126
-
127
-
128
-
129
-
130
-
131
-
132
-
133
-
134
-
135
-
136
-
137
-
138
-
139
-
140
-
141
-
142
-
143
-
144
-
145
-
146
-
147
-
148
-
149
-
150
-
151
-
152
-
153
-
154
-
155
-
156
-
157
-
158
-
159
-
160
-
161
-
162
-
163
-
164
-
165
-
166
-
167
-
168
-
169
-
170
-
171
-
172
-
173
-
174
-
175
-
176
-
177
-
178
-
179
-
180
-
181
-
182
-
183
-
184
-
185
-
186
-
187
-
188
-
189
-
190
-
191
-
192
-
193
-
194
-
195
-
196
-
197
-
198
-
 199
199 -
 200
200 -
 201
201 -
 202
202 -
 203
203 -
 204
204 -
 205
205 -
 206
206 -
 207
207 -
 208
208 -
 209
209 -
 210
210 -
 211
211 -
 212
212 -
 213
213 -
 214
214 -
 215
215 -
 216
216 -
 217
217 -
 218
218 -
 219
219 -
220
-
221
-
222
-
223
-
224
-
225
-
226
-
227
-
228
-
229
-
230
-
231
-
232
-
233
-
234
-
235
-
236
-
237
-
238
-
239
-
240
-
241
-
242
-
243
-
244
-
245
-
246
-
247
-
248
-
249
-
250
-
251
-
252
-
253
-
254
-
255
-
256
-
257
-
258
-
259
-
260
-
261
-
262
-
263
-
264
-
265
-
266
-
267
-
268
-
269
-
270
-
271
-
272
-
273
-
274
-
275
-
276
-
277
-
278
-
279
 |
 |

205
~53~
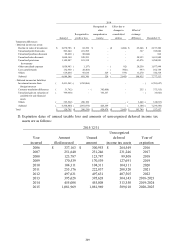
(21) Other equity items
(22) Operating revenue
(23) Other income
(24) Other gains (losses)
Gain (loss) on Unrealized gain Financial statements
effective portion on valuation of translation Remeasurement
of cash flow available-for-sale differences of of defined
hedges financial assets foreign operations benefit plans Total
January 1, 2015 365,822$ 28,011,777$ 1,940,298$ 20,045)($ 30,297,852$
-the Company - 2,512,144)( 1,749,055 - 763,089)(
-Subsidiaries 521,463 15,212 762,065)( 39,583)( 264,973)(
-Associates - 10)( 360 - 350
December 31, 2015 887,285$ 25,514,835$ 2,927,648$ 59,628)($ 29,270,140$
Gain (loss) on Unrealized gain Financial statements
effective portion on valuation of translation Remeasurement
of cash flow available-for-sale differences of of defined
hedges financial assets foreign operations benefit plans Total
January 1, 2014 234,997)($ 7,353,574$ 271,393)($ 4,936)($ 6,842,248$
-the Company - 20,639,841 2,375,434 - 23,015,275
-Subsidiaries 600,819 18,349 163,705)( 15,109)( 440,354
-Associates - 13 38)( - 25)(
December 31, 2014 365,822$ 28,011,777$ 1,940,298$ 20,045)($ 30,297,852$
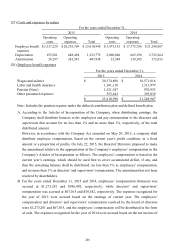
2015 2014
Sales revenue 472,335,318$ 477,408,049$
For the years ended December 31,
2015 2014
Interest income 698,203$ 655,179$
Dividend income 2,400,017 1,750,230
3,098,220$ 2,405,409$
For the years ended December 31,
2015 2014
Net gains (losses) on non-derivative 10,233$ 45,544$
financial instruments
Net gains (losses) on derivative 1,535,659 3,101,460
financial instruments
Net currency exchange gains (losses) 3,566,013)( 3,033,256)(
Gains (losses) on disposal of investments 71,840 396,135
Compensation, subsidy and other net gains (losses) 635,787 1,018,037
1,312,494)($ 1,527,920$
For the years ended December 31,