Asus 2015 Annual Report Download - page 230
Download and view the complete annual report
Please find page 230 of the 2015 Asus annual report below. You can navigate through the pages in the report by either clicking on the pages listed below, or by using the keyword search tool below to find specific information within the annual report.-
 1
1 -
2
-
3
-
4
-
5
-
6
-
7
-
8
-
9
-
10
-
11
-
12
-
13
-
14
-
15
-
16
-
17
-
18
-
19
-
20
-
21
-
22
-
23
-
24
-
25
-
26
-
27
-
28
-
29
-
30
-
31
-
32
-
33
-
34
-
35
-
36
-
37
-
38
-
39
-
40
-
41
-
42
-
43
-
44
-
45
-
46
-
47
-
48
-
49
-
50
-
51
-
52
-
53
-
54
-
55
-
56
-
57
-
58
-
59
-
60
-
61
-
62
-
63
-
64
-
65
-
66
-
67
-
68
-
69
-
70
-
71
-
72
-
73
-
74
-
75
-
76
-
77
-
78
-
79
-
80
-
81
-
82
-
83
-
84
-
85
-
86
-
87
-
88
-
89
-
90
-
91
-
92
-
93
-
94
-
95
-
96
-
97
-
98
-
99
-
100
-
101
-
102
-
103
-
104
-
105
-
106
-
107
-
108
-
109
-
110
-
111
-
112
-
113
-
114
-
115
-
116
-
117
-
118
-
119
-
120
-
121
-
122
-
123
-
124
-
125
-
126
-
127
-
128
-
129
-
130
-
131
-
132
-
133
-
134
-
135
-
136
-
137
-
138
-
139
-
140
-
141
-
142
-
143
-
144
-
145
-
146
-
147
-
148
-
149
-
150
-
151
-
152
-
153
-
154
-
155
-
156
-
157
-
158
-
159
-
160
-
161
-
162
-
163
-
164
-
165
-
166
-
167
-
168
-
169
-
170
-
171
-
172
-
173
-
174
-
175
-
176
-
177
-
178
-
179
-
180
-
181
-
182
-
183
-
184
-
185
-
186
-
187
-
188
-
189
-
190
-
191
-
192
-
193
-
194
-
195
-
196
-
197
-
198
-
199
-
200
-
201
-
202
-
203
-
204
-
205
-
206
-
207
-
208
-
209
-
210
-
211
-
212
-
213
-
214
-
215
-
216
-
217
-
218
-
219
-
 220
220 -
 221
221 -
 222
222 -
 223
223 -
 224
224 -
 225
225 -
 226
226 -
 227
227 -
 228
228 -
 229
229 -
 230
230 -
 231
231 -
 232
232 -
 233
233 -
 234
234 -
 235
235 -
 236
236 -
 237
237 -
 238
238 -
 239
239 -
 240
240 -
241
-
242
-
243
-
244
-
245
-
246
-
247
-
248
-
249
-
250
-
251
-
252
-
253
-
254
-
255
-
256
-
257
-
258
-
259
-
260
-
261
-
262
-
263
-
264
-
265
-
266
-
267
-
268
-
269
-
270
-
271
-
272
-
273
-
274
-
275
-
276
-
277
-
278
-
279
 |
 |

226
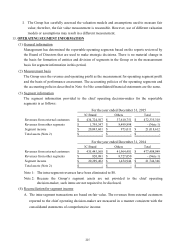
B. The reconciliation of the reportable operating segment’s profit (others are the same as
consolidated statements of comprehensive income) is as follows:
(5) Geographical information
Geographical information for the years ended December 31, 2015 and 2014 is as follows:
The above non-current assets exclude financing instruments, deferred income tax assets and
certain other non-current assets.
(6) Major customer information
No single customer accounts for more than 10% of the consolidated operating revenue for the
years ended December 31, 2015 and 2014.
2015 2014
Reportable operating segments’ profit 21,018,612$ 21,744,346$
before adjustment
Unallocated profit (loss) 12,236)( 34,382)(
Reportable operating segments’ profit 21,006,376$ 21,709,964$
For the years ended December 31,
Revenue
Non-current assets
Revenue
Non-current assets
Taiwan 65,467,443$ 7,378,115$ 65,831,059$ 7,657,990$
China 79,304,306 5,405,176 71,952,487 5,457,880
Singapore 188,439,229 4,215 233,097,713 5,428
USA 77,563,541 263,655 79,274,255 275,192
Europe 34,645,710 64,406 3,720,391 61,871
Others 26,915,089 441,699 23,532,144 441,980
Total 472,335,318$ 13,557,266$ 477,408,049$ 13,900,341$
For the years ended December 31,
2015
2014