Asus 2015 Annual Report Download - page 198
Download and view the complete annual report
Please find page 198 of the 2015 Asus annual report below. You can navigate through the pages in the report by either clicking on the pages listed below, or by using the keyword search tool below to find specific information within the annual report.-
 1
1 -
2
-
3
-
4
-
5
-
6
-
7
-
8
-
9
-
10
-
11
-
12
-
13
-
14
-
15
-
16
-
17
-
18
-
19
-
20
-
21
-
22
-
23
-
24
-
25
-
26
-
27
-
28
-
29
-
30
-
31
-
32
-
33
-
34
-
35
-
36
-
37
-
38
-
39
-
40
-
41
-
42
-
43
-
44
-
45
-
46
-
47
-
48
-
49
-
50
-
51
-
52
-
53
-
54
-
55
-
56
-
57
-
58
-
59
-
60
-
61
-
62
-
63
-
64
-
65
-
66
-
67
-
68
-
69
-
70
-
71
-
72
-
73
-
74
-
75
-
76
-
77
-
78
-
79
-
80
-
81
-
82
-
83
-
84
-
85
-
86
-
87
-
88
-
89
-
90
-
91
-
92
-
93
-
94
-
95
-
96
-
97
-
98
-
99
-
100
-
101
-
102
-
103
-
104
-
105
-
106
-
107
-
108
-
109
-
110
-
111
-
112
-
113
-
114
-
115
-
116
-
117
-
118
-
119
-
120
-
121
-
122
-
123
-
124
-
125
-
126
-
127
-
128
-
129
-
130
-
131
-
132
-
133
-
134
-
135
-
136
-
137
-
138
-
139
-
140
-
141
-
142
-
143
-
144
-
145
-
146
-
147
-
148
-
149
-
150
-
151
-
152
-
153
-
154
-
155
-
156
-
157
-
158
-
159
-
160
-
161
-
162
-
163
-
164
-
165
-
166
-
167
-
168
-
169
-
170
-
171
-
172
-
173
-
174
-
175
-
176
-
177
-
178
-
179
-
180
-
181
-
182
-
183
-
184
-
185
-
186
-
187
-
 188
188 -
 189
189 -
 190
190 -
 191
191 -
 192
192 -
 193
193 -
 194
194 -
 195
195 -
 196
196 -
 197
197 -
 198
198 -
 199
199 -
 200
200 -
 201
201 -
 202
202 -
 203
203 -
 204
204 -
 205
205 -
 206
206 -
 207
207 -
 208
208 -
209
-
210
-
211
-
212
-
213
-
214
-
215
-
216
-
217
-
218
-
219
-
220
-
221
-
222
-
223
-
224
-
225
-
226
-
227
-
228
-
229
-
230
-
231
-
232
-
233
-
234
-
235
-
236
-
237
-
238
-
239
-
240
-
241
-
242
-
243
-
244
-
245
-
246
-
247
-
248
-
249
-
250
-
251
-
252
-
253
-
254
-
255
-
256
-
257
-
258
-
259
-
260
-
261
-
262
-
263
-
264
-
265
-
266
-
267
-
268
-
269
-
270
-
271
-
272
-
273
-
274
-
275
-
276
-
277
-
278
-
279
 |
 |

194
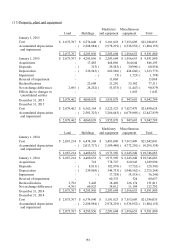
(11) Property, plant and equipment
Machinery Miscellaneous
Land Buildings and equipment equipment Total
January 1, 2015
Cost 2,075,767$ 6,574,840$ 5,181,823$ 7,553,605$ 21,386,035$
Accumulated depreciation - 2,288,984)( 2,978,219)( 6,536,952)( 11,804,155)(
and impairment
2,075,767$ 4,285,856$ 2,203,604$ 1,016,653$ 9,581,880$
January 1, 2015 2,075,767$ 4,285,856$ 2,203,604$ 1,016,653$ 9,581,880$
Acquisitions - 17,485 464,066 364,644 846,195
Disposals - 315)( 29,545)( 30,996)( 60,856)(
Depreciation - 236,543)( 662,566)( 424,666)( 1,323,775)(
Impairment - - 75)( 1,723)( 1,798)(
Reversal of impairment - - 13,068 - 13,068
Reclassifications - 22,608 21,201 33,502 77,311
Net exchange differences 2,695 28,252)( 53,875)( 11,447)( 90,879)(
Effects due to changes in - - - 1,643 1,643
consolidated entities
December 31, 2015 2,078,462$ 4,060,839$ 1,955,878$ 947,610$ 9,042,789$
December 31, 2015
Cost 2,078,462$ 6,562,164$ 5,222,523$ 7,627,479$ 21,490,628$
Accumulated depreciation - 2,501,325)( 3,266,645)( 6,679,869)( 12,447,839)(
and impairment
2,078,462$ 4,060,839$ 1,955,878$ 947,610$ 9,042,789$
Machinery Miscellaneous
Land Buildings and equipment equipment Total
January 1, 2014
Cost 2,067,214$ 6,474,369$ 5,483,009$ 7,017,449$ 21,042,041$
Accumulated depreciation - 2,013,717)( 3,509,440)( 4,772,201)( 10,295,358)(
and impairment
2,067,214$ 4,460,652$ 1,973,569$ 2,245,248$ 10,746,683$
January 1, 2014 2,067,214$ 4,460,652$ 1,973,569$ 2,245,248$ 10,746,683$
Acquisitions - 718 778,727 610,545 1,389,990
Disposals - 8,813)( 102,978)( 17,752)( 129,543)(
Depreciation - 239,969)( 544,733)( 1,940,562)( 2,725,264)(
Impairment - - 17,728)( 18,518)( 36,246)(
Reversal of impairment - - 60,333 324 60,657
Reclassifications 3,792 3,443 18,402 126,174 151,811
Net exchange differences 4,761 69,825 38,012 11,194 123,792
December 31, 2014 2,075,767$ 4,285,856$ 2,203,604$ 1,016,653$ 9,581,880$
December 31, 2014
Cost 2,075,767$ 6,574,840$ 5,181,823$ 7,553,605$ 21,386,035$
Accumulated depreciation - 2,288,984)( 2,978,219)( 6,536,952)( 11,804,155)(
and impairment
2,075,767$ 4,285,856$ 2,203,604$ 1,016,653$ 9,581,880$