Asus 2015 Annual Report Download - page 222
Download and view the complete annual report
Please find page 222 of the 2015 Asus annual report below. You can navigate through the pages in the report by either clicking on the pages listed below, or by using the keyword search tool below to find specific information within the annual report.-
 1
1 -
2
-
3
-
4
-
5
-
6
-
7
-
8
-
9
-
10
-
11
-
12
-
13
-
14
-
15
-
16
-
17
-
18
-
19
-
20
-
21
-
22
-
23
-
24
-
25
-
26
-
27
-
28
-
29
-
30
-
31
-
32
-
33
-
34
-
35
-
36
-
37
-
38
-
39
-
40
-
41
-
42
-
43
-
44
-
45
-
46
-
47
-
48
-
49
-
50
-
51
-
52
-
53
-
54
-
55
-
56
-
57
-
58
-
59
-
60
-
61
-
62
-
63
-
64
-
65
-
66
-
67
-
68
-
69
-
70
-
71
-
72
-
73
-
74
-
75
-
76
-
77
-
78
-
79
-
80
-
81
-
82
-
83
-
84
-
85
-
86
-
87
-
88
-
89
-
90
-
91
-
92
-
93
-
94
-
95
-
96
-
97
-
98
-
99
-
100
-
101
-
102
-
103
-
104
-
105
-
106
-
107
-
108
-
109
-
110
-
111
-
112
-
113
-
114
-
115
-
116
-
117
-
118
-
119
-
120
-
121
-
122
-
123
-
124
-
125
-
126
-
127
-
128
-
129
-
130
-
131
-
132
-
133
-
134
-
135
-
136
-
137
-
138
-
139
-
140
-
141
-
142
-
143
-
144
-
145
-
146
-
147
-
148
-
149
-
150
-
151
-
152
-
153
-
154
-
155
-
156
-
157
-
158
-
159
-
160
-
161
-
162
-
163
-
164
-
165
-
166
-
167
-
168
-
169
-
170
-
171
-
172
-
173
-
174
-
175
-
176
-
177
-
178
-
179
-
180
-
181
-
182
-
183
-
184
-
185
-
186
-
187
-
188
-
189
-
190
-
191
-
192
-
193
-
194
-
195
-
196
-
197
-
198
-
199
-
200
-
201
-
202
-
203
-
204
-
205
-
206
-
207
-
208
-
209
-
210
-
211
-
 212
212 -
 213
213 -
 214
214 -
 215
215 -
 216
216 -
 217
217 -
 218
218 -
 219
219 -
 220
220 -
 221
221 -
 222
222 -
 223
223 -
 224
224 -
 225
225 -
 226
226 -
 227
227 -
 228
228 -
 229
229 -
 230
230 -
 231
231 -
 232
232 -
233
-
234
-
235
-
236
-
237
-
238
-
239
-
240
-
241
-
242
-
243
-
244
-
245
-
246
-
247
-
248
-
249
-
250
-
251
-
252
-
253
-
254
-
255
-
256
-
257
-
258
-
259
-
260
-
261
-
262
-
263
-
264
-
265
-
266
-
267
-
268
-
269
-
270
-
271
-
272
-
273
-
274
-
275
-
276
-
277
-
278
-
279
 |
 |

218
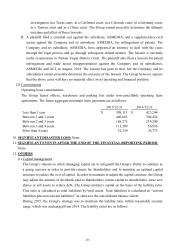
f. Net currency exchange losses (including realized and unrealized) arising from
significant foreign exchange variation on the monetary items held by the Group for the
years ended December 31, 2015 and 2014 amounted to $3,566,013 and $3,033,256,
respectively.
Price risk
a. The Group is exposed to equity securities price risk because of investments held by the
Group either as available-for-sale on stock investments or at fair value through profit or
loss. To manage its price risk arising from investments in equity securities, the Group
diversifies its portfolio. Diversification of the portfolio is done in accordance with the
limits set by the Group.
b. The prices of the Group’s investments in equity securities would change due to the
change of the future value of investee companies. If the prices of these equity securities
had increased by 1% with all other variables held constant, non-operating revenues for
the years ended December 31, 2015 and 2014 would have increased by $2,031 and
$1,763, respectively. Other comprehensive income - unrealized gain on valuation of
available-for-sale financial assets would have increased by $525,876 and $549,765,
respectively. The Group is exposed to equity securities price risk because of investments
held by the Group and classified on the consolidated balance sheets either as
available-for-sale or at fair value through profit or loss. The Group has no price risk of
merchandise inventories. To manage its price risk arising from investments in equity
securities, the Group diversifies its portfolio. Diversification of the portfolio is done in
accordance with the limits set by the Group.
Interest rate risk
a. The Group’s interest rate risk arises from long-term borrowings. Borrowings issued at
variable rates expose the Group to cash flow interest rate risk which is partially offset by
cash and cash equivalents held at variable rates. Borrowings issued at fixed rates expose
the Group to fair value interest rate risk. During the years ended December 31, 2015 and
2014, the Group’s borrowings at variable rate were denominated in USD and NTD.
b. The Group analyses its interest rate exposure on a dynamic basis. Various scenarios are
simulated taking into consideration refinancing, renewal of existing positions,
alternative financing and hedging. Based on these scenarios, the Group calculates the
impact on profit and loss of a defined interest rate shift. For each simulation, the same
interest rate shift is used for all currencies. The scenarios are run only for liabilities that
represent the major interest-bearing positions. The Group expects no significant interest
rate risk.
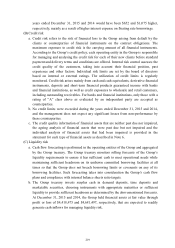
c. At December 31, 2015 and 2014, if interest rates on borrowings had been 1 basis point
(0.01%) higher with all other variables held constant, non-operating expenses for the