Asus 2015 Annual Report Download - page 127
Download and view the complete annual report
Please find page 127 of the 2015 Asus annual report below. You can navigate through the pages in the report by either clicking on the pages listed below, or by using the keyword search tool below to find specific information within the annual report.-
 1
1 -
2
-
3
-
4
-
5
-
6
-
7
-
8
-
9
-
10
-
11
-
12
-
13
-
14
-
15
-
16
-
17
-
18
-
19
-
20
-
21
-
22
-
23
-
24
-
25
-
26
-
27
-
28
-
29
-
30
-
31
-
32
-
33
-
34
-
35
-
36
-
37
-
38
-
39
-
40
-
41
-
42
-
43
-
44
-
45
-
46
-
47
-
48
-
49
-
50
-
51
-
52
-
53
-
54
-
55
-
56
-
57
-
58
-
59
-
60
-
61
-
62
-
63
-
64
-
65
-
66
-
67
-
68
-
69
-
70
-
71
-
72
-
73
-
74
-
75
-
76
-
77
-
78
-
79
-
80
-
81
-
82
-
83
-
84
-
85
-
86
-
87
-
88
-
89
-
90
-
91
-
92
-
93
-
94
-
95
-
96
-
97
-
98
-
99
-
100
-
101
-
102
-
103
-
104
-
105
-
106
-
107
-
108
-
109
-
110
-
111
-
112
-
113
-
114
-
115
-
116
-
 117
117 -
 118
118 -
 119
119 -
 120
120 -
 121
121 -
 122
122 -
 123
123 -
 124
124 -
 125
125 -
 126
126 -
 127
127 -
 128
128 -
 129
129 -
 130
130 -
 131
131 -
 132
132 -
 133
133 -
 134
134 -
 135
135 -
 136
136 -
 137
137 -
138
-
139
-
140
-
141
-
142
-
143
-
144
-
145
-
146
-
147
-
148
-
149
-
150
-
151
-
152
-
153
-
154
-
155
-
156
-
157
-
158
-
159
-
160
-
161
-
162
-
163
-
164
-
165
-
166
-
167
-
168
-
169
-
170
-
171
-
172
-
173
-
174
-
175
-
176
-
177
-
178
-
179
-
180
-
181
-
182
-
183
-
184
-
185
-
186
-
187
-
188
-
189
-
190
-
191
-
192
-
193
-
194
-
195
-
196
-
197
-
198
-
199
-
200
-
201
-
202
-
203
-
204
-
205
-
206
-
207
-
208
-
209
-
210
-
211
-
212
-
213
-
214
-
215
-
216
-
217
-
218
-
219
-
220
-
221
-
222
-
223
-
224
-
225
-
226
-
227
-
228
-
229
-
230
-
231
-
232
-
233
-
234
-
235
-
236
-
237
-
238
-
239
-
240
-
241
-
242
-
243
-
244
-
245
-
246
-
247
-
248
-
249
-
250
-
251
-
252
-
253
-
254
-
255
-
256
-
257
-
258
-
259
-
260
-
261
-
262
-
263
-
264
-
265
-
266
-
267
-
268
-
269
-
270
-
271
-
272
-
273
-
274
-
275
-
276
-
277
-
278
-
279
 |
 |

123
123
!
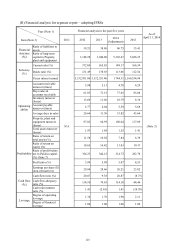
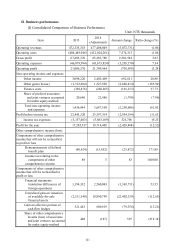
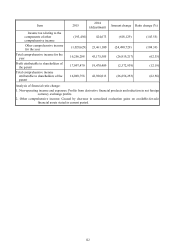
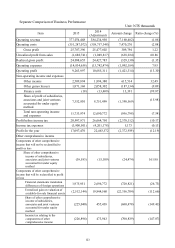
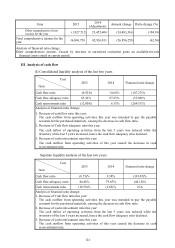
Separate Comparison of Business Performance
Unit: NT$ thousands
Item 2015 2014
(Adjustment) Amount change Ratio change (%)
Operating revenue 377,074,468 384,234,950 (7,160,482) (1.86)
Operating costs (351,287,072) (358,757,348) 7,470,276 (2.08)
Gross profit 25,787,396 25,477,602 309,794 1.22
Unrealized profit from sales (1,688,741) (1,049,817) (638,924) 60.86
Realized gross profit 24,098,655 24,427,785 (329,130) (1.35)
Operating expenses (14,834,658) (13,742,474) (1,092,184) 7.95
Operating profit 9,263,997 10,685,311 (1,421,314) (13.30)
Non-operating income and expenses
Other income 2,509,894 1,894,380 615,514 32.49
Other gains (losses) 1,871,168 2,058,302 (187,134) (9.09)
Finance costs (18) (13,409) 13,391 (99.87)
Share of profit of subsidiaries,
associates and joint ventures
accounted for under equity
method
7,352,930 8,751,499 (1,398,569) (15.98)
Total non-operating income
and expenses 11,733,974 12,690,772 (956,798) (7.54)
Profit before income tax 20,997,971 26,664,750 (2,378,112) (10.17)
Income tax expenses (3,900,501) (4,201,178) 5,173 (0.13)
Profit for the year 17,097,470 22,463,572 (2,372,939) (12.19)
Other comprehensive income
Components of other comprehensive
income that will not be reclassified to
profit or loss
Share of other comprehensive
income of subsidiaries,
associates and joint ventures
accounted for under equity
method
(39,583) (15,109) (24,474) 161.98
Components of other comprehensive
income that will be reclassified to profit
or loss
Financial statements translation
differences of foreign operations 1,975,951 2,696,772 (720,821) (26.73)
Unrealized gain on valuation of
available-for-sale financial assets (2,512,144) 19,844,560 (22,356,704) (112.66)
Share of other comprehensive
income of subsidiaries,
associates and joint ventures
accounted for under equity
method
(225,040) 455,438 (680,478) (149.41)
Income tax relating to the
components of other
comprehensive income
(226,896) 473,943 (700,839) (147.87)