Asus 2015 Annual Report Download - page 228
Download and view the complete annual report
Please find page 228 of the 2015 Asus annual report below. You can navigate through the pages in the report by either clicking on the pages listed below, or by using the keyword search tool below to find specific information within the annual report.-
 1
1 -
2
-
3
-
4
-
5
-
6
-
7
-
8
-
9
-
10
-
11
-
12
-
13
-
14
-
15
-
16
-
17
-
18
-
19
-
20
-
21
-
22
-
23
-
24
-
25
-
26
-
27
-
28
-
29
-
30
-
31
-
32
-
33
-
34
-
35
-
36
-
37
-
38
-
39
-
40
-
41
-
42
-
43
-
44
-
45
-
46
-
47
-
48
-
49
-
50
-
51
-
52
-
53
-
54
-
55
-
56
-
57
-
58
-
59
-
60
-
61
-
62
-
63
-
64
-
65
-
66
-
67
-
68
-
69
-
70
-
71
-
72
-
73
-
74
-
75
-
76
-
77
-
78
-
79
-
80
-
81
-
82
-
83
-
84
-
85
-
86
-
87
-
88
-
89
-
90
-
91
-
92
-
93
-
94
-
95
-
96
-
97
-
98
-
99
-
100
-
101
-
102
-
103
-
104
-
105
-
106
-
107
-
108
-
109
-
110
-
111
-
112
-
113
-
114
-
115
-
116
-
117
-
118
-
119
-
120
-
121
-
122
-
123
-
124
-
125
-
126
-
127
-
128
-
129
-
130
-
131
-
132
-
133
-
134
-
135
-
136
-
137
-
138
-
139
-
140
-
141
-
142
-
143
-
144
-
145
-
146
-
147
-
148
-
149
-
150
-
151
-
152
-
153
-
154
-
155
-
156
-
157
-
158
-
159
-
160
-
161
-
162
-
163
-
164
-
165
-
166
-
167
-
168
-
169
-
170
-
171
-
172
-
173
-
174
-
175
-
176
-
177
-
178
-
179
-
180
-
181
-
182
-
183
-
184
-
185
-
186
-
187
-
188
-
189
-
190
-
191
-
192
-
193
-
194
-
195
-
196
-
197
-
198
-
199
-
200
-
201
-
202
-
203
-
204
-
205
-
206
-
207
-
208
-
209
-
210
-
211
-
212
-
213
-
214
-
215
-
216
-
217
-
 218
218 -
 219
219 -
 220
220 -
 221
221 -
 222
222 -
 223
223 -
 224
224 -
 225
225 -
 226
226 -
 227
227 -
 228
228 -
 229
229 -
 230
230 -
 231
231 -
 232
232 -
 233
233 -
 234
234 -
 235
235 -
 236
236 -
 237
237 -
 238
238 -
239
-
240
-
241
-
242
-
243
-
244
-
245
-
246
-
247
-
248
-
249
-
250
-
251
-
252
-
253
-
254
-
255
-
256
-
257
-
258
-
259
-
260
-
261
-
262
-
263
-
264
-
265
-
266
-
267
-
268
-
269
-
270
-
271
-
272
-
273
-
274
-
275
-
276
-
277
-
278
-
279
 |
 |

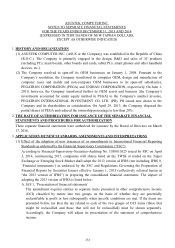
224
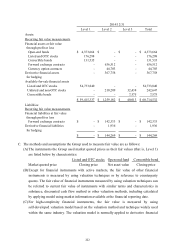
F. There was no transfer into or out from Level 3 during the years ended December 31, 2015 and
2014.
G. The investment segment is in charge of valuation procedures for fair value measurements
being categorized within Level 3, which is to verify independent fair value of financial
instruments. Such assessment is to ensure the valuation results are reasonable by applying
independent information to make results close to current market conditions, confirming the
source of information is independent, reliable and in line with other resources and any other
necessary adjustments to the fair value.
The investment segment cooperatively set up valuation policies, valuation processes and rules
for measuring fair value of financial instruments and investment property and ensure
compliance with the related requirements in IFRS.
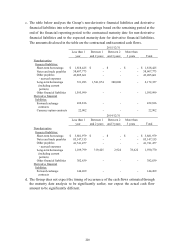
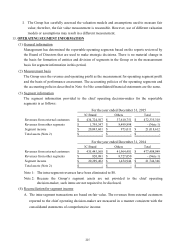
H. The following is the qualitative information of significant unobservable inputs and sensitivity
analysis of changes in significant unobservable inputs to valuation model used in Level 3 fair
value measurement:
Equity instruments
Debt instruments Total
January 1 47,846$ -$ 47,846$
Gains (losses) recognized in 1,488)( - 1,488)(
profit or loss (Note 1)
Gains (losses) recognized in net other 10,483)( - 10,483)(
comprehensive income (loss) (Note 2)
Acquisitions - 7,575 7,575
Disposals 3,437)( - 3,437)(
December 31 32,438$ 7,575$ 40,013$
Note 1: Recorded as other gains (losses).
Note 2: Recorded as unrealized valuation of available-for-sale financial assets.
For the year ended December 31, 2014
Significant Range Relationship
Fair value at Valuation unobservable (weighted of inputs to
December 31, 2015
technique
input average) fair value
Equity instruments:
Unlisted and
non-OTC stocks
28,131$
Net asset
value
Not applicable Not applicable
The higher the
net asset value,
the higher the
fair value
Debt instruments:
Convertible bonds 7,575$
Net asset
value
Not applicable Not applicable
The higher the
net asset value,
the higher the
fair value