Asus 2015 Annual Report Download - page 226
Download and view the complete annual report
Please find page 226 of the 2015 Asus annual report below. You can navigate through the pages in the report by either clicking on the pages listed below, or by using the keyword search tool below to find specific information within the annual report.-
 1
1 -
2
-
3
-
4
-
5
-
6
-
7
-
8
-
9
-
10
-
11
-
12
-
13
-
14
-
15
-
16
-
17
-
18
-
19
-
20
-
21
-
22
-
23
-
24
-
25
-
26
-
27
-
28
-
29
-
30
-
31
-
32
-
33
-
34
-
35
-
36
-
37
-
38
-
39
-
40
-
41
-
42
-
43
-
44
-
45
-
46
-
47
-
48
-
49
-
50
-
51
-
52
-
53
-
54
-
55
-
56
-
57
-
58
-
59
-
60
-
61
-
62
-
63
-
64
-
65
-
66
-
67
-
68
-
69
-
70
-
71
-
72
-
73
-
74
-
75
-
76
-
77
-
78
-
79
-
80
-
81
-
82
-
83
-
84
-
85
-
86
-
87
-
88
-
89
-
90
-
91
-
92
-
93
-
94
-
95
-
96
-
97
-
98
-
99
-
100
-
101
-
102
-
103
-
104
-
105
-
106
-
107
-
108
-
109
-
110
-
111
-
112
-
113
-
114
-
115
-
116
-
117
-
118
-
119
-
120
-
121
-
122
-
123
-
124
-
125
-
126
-
127
-
128
-
129
-
130
-
131
-
132
-
133
-
134
-
135
-
136
-
137
-
138
-
139
-
140
-
141
-
142
-
143
-
144
-
145
-
146
-
147
-
148
-
149
-
150
-
151
-
152
-
153
-
154
-
155
-
156
-
157
-
158
-
159
-
160
-
161
-
162
-
163
-
164
-
165
-
166
-
167
-
168
-
169
-
170
-
171
-
172
-
173
-
174
-
175
-
176
-
177
-
178
-
179
-
180
-
181
-
182
-
183
-
184
-
185
-
186
-
187
-
188
-
189
-
190
-
191
-
192
-
193
-
194
-
195
-
196
-
197
-
198
-
199
-
200
-
201
-
202
-
203
-
204
-
205
-
206
-
207
-
208
-
209
-
210
-
211
-
212
-
213
-
214
-
215
-
 216
216 -
 217
217 -
 218
218 -
 219
219 -
 220
220 -
 221
221 -
 222
222 -
 223
223 -
 224
224 -
 225
225 -
 226
226 -
 227
227 -
 228
228 -
 229
229 -
 230
230 -
 231
231 -
 232
232 -
 233
233 -
 234
234 -
 235
235 -
 236
236 -
237
-
238
-
239
-
240
-
241
-
242
-
243
-
244
-
245
-
246
-
247
-
248
-
249
-
250
-
251
-
252
-
253
-
254
-
255
-
256
-
257
-
258
-
259
-
260
-
261
-
262
-
263
-
264
-
265
-
266
-
267
-
268
-
269
-
270
-
271
-
272
-
273
-
274
-
275
-
276
-
277
-
278
-
279
 |
 |

222
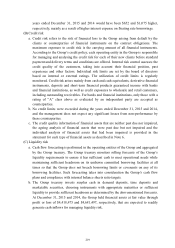
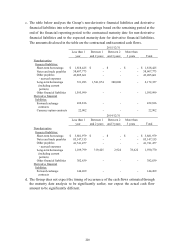
C. The methods and assumptions the Group used to measure fair value are as follows:
(A) The instruments the Group used market quoted prices as their fair values (that is, Level 1)
are listed below by characteristics:
(B) Except for financial instruments with active markets, the fair value of other financial
instruments is measured by using valuation techniques or by reference to counterparty
quotes. The fair value of financial instruments measured by using valuation techniques can
be referred to current fair value of instruments with similar terms and characteristics in
substance, discounted cash flow method or other valuation methods, including calculated
by applying model using market information available at the financial reporting date.
(C) For high-complexity financial instruments, the fair value is measured by using
self-developed valuation model based on the valuation method and technique widely used
within the same industry. The valuation model is normally applied to derivative financial
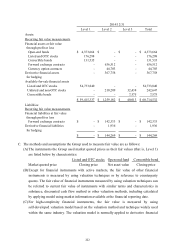
Level 1 Level 2 Level 3 Total
Assets:
Recurring fair value measurements
Financial assets at fair value
through profit or loss
Open-end funds 4,373,664$ -$ -$ 4,373,664$
Listed and OTC stocks 176,298 - - 176,298
Convertible bonds 131,535 - - 131,535
Forward exchange contracts - 636,512 - 636,512
Currency option contracts - 44,703 - 44,703
Derivative financial assets - 367,758 - 367,758
for hedging
Available-for-sale financial assets
Listed and OTC stocks 54,733,840 - - 54,733,840
Unlisted and non-OTC stocks - 210,209 32,438 242,647
Convertible bonds - - 7,575 7,575
59,415,337$ 1,259,182$ 40,013$ 60,714,532$
Liabilities:
Recurring fair value measurements
Financial liabilities at fair value
through profit or loss
Forward exchange contracts -$ 142,333$ -$ 142,333$
Derivative financial liabilities - 1,936 - 1,936
for hedging
-$ 144,269$ -$ 144,269$
2014/12/31
Listed and OTC stocks
Open-end fund
Convertible bond
Market quoted price Closing price Net asset value Closing price