Asus 2015 Annual Report Download - page 229
Download and view the complete annual report
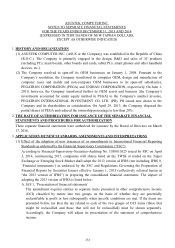
Please find page 229 of the 2015 Asus annual report below. You can navigate through the pages in the report by either clicking on the pages listed below, or by using the keyword search tool below to find specific information within the annual report.-
 1
1 -
2
-
3
-
4
-
5
-
6
-
7
-
8
-
9
-
10
-
11
-
12
-
13
-
14
-
15
-
16
-
17
-
18
-
19
-
20
-
21
-
22
-
23
-
24
-
25
-
26
-
27
-
28
-
29
-
30
-
31
-
32
-
33
-
34
-
35
-
36
-
37
-
38
-
39
-
40
-
41
-
42
-
43
-
44
-
45
-
46
-
47
-
48
-
49
-
50
-
51
-
52
-
53
-
54
-
55
-
56
-
57
-
58
-
59
-
60
-
61
-
62
-
63
-
64
-
65
-
66
-
67
-
68
-
69
-
70
-
71
-
72
-
73
-
74
-
75
-
76
-
77
-
78
-
79
-
80
-
81
-
82
-
83
-
84
-
85
-
86
-
87
-
88
-
89
-
90
-
91
-
92
-
93
-
94
-
95
-
96
-
97
-
98
-
99
-
100
-
101
-
102
-
103
-
104
-
105
-
106
-
107
-
108
-
109
-
110
-
111
-
112
-
113
-
114
-
115
-
116
-
117
-
118
-
119
-
120
-
121
-
122
-
123
-
124
-
125
-
126
-
127
-
128
-
129
-
130
-
131
-
132
-
133
-
134
-
135
-
136
-
137
-
138
-
139
-
140
-
141
-
142
-
143
-
144
-
145
-
146
-
147
-
148
-
149
-
150
-
151
-
152
-
153
-
154
-
155
-
156
-
157
-
158
-
159
-
160
-
161
-
162
-
163
-
164
-
165
-
166
-
167
-
168
-
169
-
170
-
171
-
172
-
173
-
174
-
175
-
176
-
177
-
178
-
179
-
180
-
181
-
182
-
183
-
184
-
185
-
186
-
187
-
188
-
189
-
190
-
191
-
192
-
193
-
194
-
195
-
196
-
197
-
198
-
199
-
200
-
201
-
202
-
203
-
204
-
205
-
206
-
207
-
208
-
209
-
210
-
211
-
212
-
213
-
214
-
215
-
216
-
217
-
218
-
 219
219 -
 220
220 -
 221
221 -
 222
222 -
 223
223 -
 224
224 -
 225
225 -
 226
226 -
 227
227 -
 228
228 -
 229
229 -
 230
230 -
 231
231 -
 232
232 -
 233
233 -
 234
234 -
 235
235 -
 236
236 -
 237
237 -
 238
238 -
 239
239 -
240
-
241
-
242
-
243
-
244
-
245
-
246
-
247
-
248
-
249
-
250
-
251
-
252
-
253
-
254
-
255
-
256
-
257
-
258
-
259
-
260
-
261
-
262
-
263
-
264
-
265
-
266
-
267
-
268
-
269
-
270
-
271
-
272
-
273
-
274
-
275
-
276
-
277
-
278
-
279
 |
 |

225
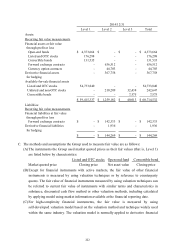
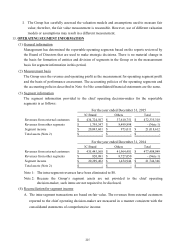
I. The Group has carefully assessed the valuation models and assumptions used to measure fair
value; therefore, the fair value measurement is reasonable. However, use of different valuation
models or assumptions may result in a different measurement.
13. OPERATING SEGMENT INFORMATION
(1) General information
Management has determined the reportable operating segments based on the reports reviewed by
the Board of Directors that are used to make strategic decisions. There is no material change in
the basis for formation of entities and division of segments in the Group or in the measurement
basis for segment information in this period.
(2) Measurement basis
The Group uses the revenue and operating profit as the measurement for operating segment profit
and the basis of performance assessment. The accounting policies of the operating segments and
the accounting policies described in Note 4 of the consolidated financial statements are the same.
(3) Segment information
The segment information provided to the chief operating decision-maker for the reportable
segments is as follows:
Note 1:
The intra-segment revenues have been eliminated to $0.
Note 2:
Because the Group’s segment assets are not provided to the chief operating
decision-maker, such items are not required to be disclosed.
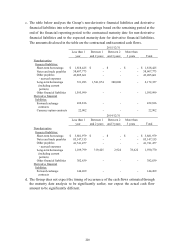
(4) Reconciliation for segment income
A. The intra-segment transactions are based on fair value. The revenues from external customers
reported to the chief operating decision-maker are measured in a manner consistent with the
consolidated statements of comprehensive income.
3C Brand Others Total
Revenues from external customers 434,724,567$ 37,610,751$ 472,335,318$
Revenues from other segments 1,795,347$ 8,499,898$ - (Note 1)
Segment income 20,045,601$ 973,011$ 21,018,612$
Total assets (Note 2) -$ -$ -$
For the year ended December 31, 2015
3C Brand Others Total
Revenues from external customers 435,443,568$ 41,964,481$ 477,408,049$
Revenues from other segments 820,081$ 8,727,050$ - (Note 1)
Segment income 20,289,402$ 1,454,944$ 21,744,346$
Total assets (Note 2) -$ -$ -$
For the year ended December 31, 2014