Asus 2015 Annual Report Download - page 274
Download and view the complete annual report
Please find page 274 of the 2015 Asus annual report below. You can navigate through the pages in the report by either clicking on the pages listed below, or by using the keyword search tool below to find specific information within the annual report.-
 1
1 -
2
-
3
-
4
-
5
-
6
-
7
-
8
-
9
-
10
-
11
-
12
-
13
-
14
-
15
-
16
-
17
-
18
-
19
-
20
-
21
-
22
-
23
-
24
-
25
-
26
-
27
-
28
-
29
-
30
-
31
-
32
-
33
-
34
-
35
-
36
-
37
-
38
-
39
-
40
-
41
-
42
-
43
-
44
-
45
-
46
-
47
-
48
-
49
-
50
-
51
-
52
-
53
-
54
-
55
-
56
-
57
-
58
-
59
-
60
-
61
-
62
-
63
-
64
-
65
-
66
-
67
-
68
-
69
-
70
-
71
-
72
-
73
-
74
-
75
-
76
-
77
-
78
-
79
-
80
-
81
-
82
-
83
-
84
-
85
-
86
-
87
-
88
-
89
-
90
-
91
-
92
-
93
-
94
-
95
-
96
-
97
-
98
-
99
-
100
-
101
-
102
-
103
-
104
-
105
-
106
-
107
-
108
-
109
-
110
-
111
-
112
-
113
-
114
-
115
-
116
-
117
-
118
-
119
-
120
-
121
-
122
-
123
-
124
-
125
-
126
-
127
-
128
-
129
-
130
-
131
-
132
-
133
-
134
-
135
-
136
-
137
-
138
-
139
-
140
-
141
-
142
-
143
-
144
-
145
-
146
-
147
-
148
-
149
-
150
-
151
-
152
-
153
-
154
-
155
-
156
-
157
-
158
-
159
-
160
-
161
-
162
-
163
-
164
-
165
-
166
-
167
-
168
-
169
-
170
-
171
-
172
-
173
-
174
-
175
-
176
-
177
-
178
-
179
-
180
-
181
-
182
-
183
-
184
-
185
-
186
-
187
-
188
-
189
-
190
-
191
-
192
-
193
-
194
-
195
-
196
-
197
-
198
-
199
-
200
-
201
-
202
-
203
-
204
-
205
-
206
-
207
-
208
-
209
-
210
-
211
-
212
-
213
-
214
-
215
-
216
-
217
-
218
-
219
-
220
-
221
-
222
-
223
-
224
-
225
-
226
-
227
-
228
-
229
-
230
-
231
-
232
-
233
-
234
-
235
-
236
-
237
-
238
-
239
-
240
-
241
-
242
-
243
-
244
-
245
-
246
-
247
-
248
-
249
-
250
-
251
-
252
-
253
-
254
-
255
-
256
-
257
-
258
-
259
-
260
-
261
-
262
-
263
-
 264
264 -
 265
265 -
 266
266 -
 267
267 -
 268
268 -
 269
269 -
 270
270 -
 271
271 -
 272
272 -
 273
273 -
 274
274 -
 275
275 -
 276
276 -
 277
277 -
 278
278 -
 279
279
 |
 |

270
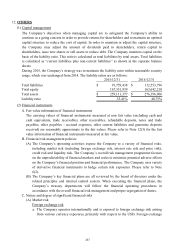
monitored. Credit risk arises from cash and cash equivalents, derivative financial
instruments and deposits with banks and financial institutions, as well as credit
exposures to wholesale, including outstanding receivables. For banks and financial
institutions, only those with a rating of “A” class above as evaluated by an independent
party are accepted as counterparties.
b. No credit limits were exceeded during 2015 and 2014, and management does not expect
any significant losses from non-performance by these counterparties.
c. The credit quality information of financial assets that are neither past due nor impaired,
the aging analysis of financial assets that were past due but not impaired and the
individual analysis of financial assets that had been impaired is provided in the
statement for each type of financial assets as described in Note 6.
(B) Liquidity risk
a. Cash flow forecasting is performed in the operating entities of the Company and
aggregated by the Company treasury to monitor rolling forecasts of the Company’s
liquidity requirements and ensure it has sufficient cash to meet operational needs while
maintaining sufficient headroom at all times. Such forecasting takes into consideration
the Company’s cash flow plans and compliance with internal balance sheets ratio
targets.
b. The Company’s treasury invests surplus cash in demand deposits, time deposits and
marketable securities, choosing instruments with appropriate maturities or sufficient
liquidity to provide sufficient headroom as determined by the abovementioned forecasts.
At December 31, 2015 and 2014, the Company held financial assets at fair value
through profit or loss of $3,710,599 and $3,420,751, respectively, that are expected to
readily generate cash inflows for managing liquidity risk.
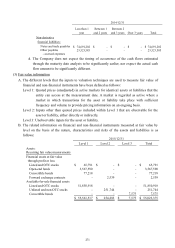
c. The table below analyses the Company’s non-derivative financial liabilities into relevant
maturity groupings based on the remaining period at the end of the financial reporting
period to the contractual maturity date for non-derivative financial liabilities. The
amounts disclosed in the table are the contractual undiscounted cash flows.
Less than 1
year
Between 1
and 2 years
Between 2
and 3 years
Over 3 years
Total
Non-derivative
financial liabilities:
Notes and trade payables 49,061,306$ -$ -$ -$ 49,061,306$
Other payables
- accrued expenses
25,760,871 - - - 25,760,871
2015/12/31