US Airways 2006 Annual Report Download - page 98
Download and view the complete annual report
Please find page 98 of the 2006 US Airways annual report below. You can navigate through the pages in the report by either clicking on the pages listed below, or by using the keyword search tool below to find specific information within the annual report.-
 1
1 -
2
-
3
-
4
-
5
-
6
-
7
-
8
-
9
-
10
-
11
-
12
-
13
-
14
-
15
-
16
-
17
-
18
-
19
-
20
-
21
-
22
-
23
-
24
-
25
-
26
-
27
-
28
-
29
-
30
-
31
-
32
-
33
-
34
-
35
-
36
-
37
-
38
-
39
-
40
-
41
-
42
-
43
-
44
-
45
-
46
-
47
-
48
-
49
-
50
-
51
-
52
-
53
-
54
-
55
-
56
-
57
-
58
-
59
-
60
-
61
-
62
-
63
-
64
-
65
-
66
-
67
-
68
-
69
-
70
-
71
-
72
-
73
-
74
-
75
-
76
-
77
-
78
-
79
-
80
-
81
-
82
-
83
-
84
-
85
-
86
-
87
-
 88
88 -
 89
89 -
 90
90 -
 91
91 -
 92
92 -
 93
93 -
 94
94 -
 95
95 -
 96
96 -
 97
97 -
 98
98 -
 99
99 -
 100
100 -
 101
101 -
 102
102 -
 103
103 -
 104
104 -
 105
105 -
 106
106 -
 107
107 -
 108
108 -
109
-
110
-
111
-
112
-
113
-
114
-
115
-
116
-
117
-
118
-
119
-
120
-
121
-
122
-
123
-
124
-
125
-
126
-
127
-
128
-
129
-
130
-
131
-
132
-
133
-
134
-
135
-
136
-
137
-
138
-
139
-
140
-
141
-
142
-
143
-
144
-
145
-
146
-
147
-
148
-
149
-
150
-
151
-
152
-
153
-
154
-
155
-
156
-
157
-
158
-
159
-
160
-
161
-
162
-
163
-
164
-
165
-
166
-
167
-
168
-
169
-
170
-
171
-
172
-
173
-
174
-
175
-
176
-
177
-
178
-
179
-
180
-
181
-
182
-
183
-
184
-
185
-
186
-
187
-
188
-
189
-
190
-
191
-
192
-
193
-
194
-
195
-
196
-
197
-
198
-
199
-
200
-
201
-
202
-
203
-
204
-
205
-
206
-
207
-
208
-
209
-
210
-
211
-
212
-
213
-
214
-
215
-
216
-
217
-
218
-
219
-
220
-
221
-
222
-
223
-
224
-
225
-
226
-
227
-
228
-
229
-
230
-
231
-
232
-
233
-
234
-
235
-
236
-
237
-
238
-
239
-
240
-
241
-
242
-
243
-
244
-
245
-
246
-
247
-
248
-
249
-
250
-
251
-
252
-
253
-
254
-
255
-
256
-
257
-
258
-
259
-
260
-
261
-
262
-
263
-
264
-
265
-
266
-
267
-
268
-
269
-
270
-
271
-
272
-
273
-
274
-
275
-
276
-
277
-
278
-
279
-
280
-
281
 |
 |

Table of Contents
US Airways Group, Inc.
Notes to Consolidated Financial Statements — (Continued)
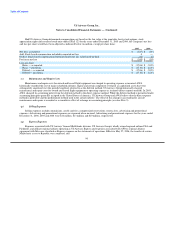
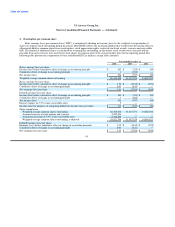
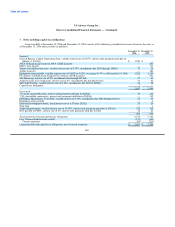
4. Earning/loss per common share
Basic earnings (loss) per common share ("EPS") is computed by dividing net income (loss) by the weighted average number of
shares of common stock outstanding during the period. Diluted EPS reflects the maximum dilution that would result after giving effect to
all potential dilutive common shares from stock options, stock appreciation rights, restricted stock unit awards, warrants and convertible
debt. The number of additional shares is calculated by assuming that outstanding, in-the-money stock awards were exercised and the
proceeds from such exercises were used to buy back shares of common stock at the average market price for the reporting period. The
following table presents the computation of basic and diluted EPS (in millions, except share amounts):
Year Ended December 31,
2006 2005 2004
Basic earnings (loss) per share:
Income (loss) before cumulative effect of change in accounting principle $ 303 $ (335) $ (89)
Cumulative effect of change in accounting principle 1 (202) —
Net income (loss) $ 304 $ (537) $ (89)
Weighted average common shares outstanding 86,446,638 31,487,574 14,860,922
Basic earnings (loss) per share:
Income (loss) before cumulative effect of change in accounting principle $ 3.50 $ (10.65) $ (5.99)
Cumulative effect of change in accounting principle 0.01 (6.41) —
Net earnings (loss) per share $ 3.51 $ (17.06) $ (5.99)
Diluted earnings (loss) per share:
Income (loss) before cumulative effect of change in accounting principle $ 303 $ (335) $ (89)
Cumulative effect of change in accounting principle 1 (202) —
Net income (loss) 304 (537) (89)
Interest expense on 7.0% senior convertible notes 9 — —
Income (loss) for purposes of computing diluted net income (loss) per share $ 313 $ (537) $ (89)
Share computation:
Weighted average common shares outstanding 86,446,638 31,487,574 14,860,922
Assumed exercise of stock options and warrants 2,058,814 — —
Assumed conversion of 7.0% senior convertible notes 5,316,296 — —
Weighted average common shares outstanding as adjusted 93,821,748 31,487,574 14,860,922
Diluted earnings (loss) per share:
Earnings (loss) before cumulative effect of change in accounting principle $ 3.32 $ (10.65) $ (5.99)
Cumulative effect of change in accounting principle 0.01 (6.41) —
Net earnings (loss) per share $ 3.33 $ (17.06) $ (5.99)
95