US Airways 2006 Annual Report Download - page 52
Download and view the complete annual report
Please find page 52 of the 2006 US Airways annual report below. You can navigate through the pages in the report by either clicking on the pages listed below, or by using the keyword search tool below to find specific information within the annual report.-
 1
1 -
2
-
3
-
4
-
5
-
6
-
7
-
8
-
9
-
10
-
11
-
12
-
13
-
14
-
15
-
16
-
17
-
18
-
19
-
20
-
21
-
22
-
23
-
24
-
25
-
26
-
27
-
28
-
29
-
30
-
31
-
32
-
33
-
34
-
35
-
36
-
37
-
38
-
39
-
40
-
41
-
 42
42 -
 43
43 -
 44
44 -
 45
45 -
 46
46 -
 47
47 -
 48
48 -
 49
49 -
 50
50 -
 51
51 -
 52
52 -
 53
53 -
 54
54 -
 55
55 -
 56
56 -
 57
57 -
 58
58 -
 59
59 -
 60
60 -
 61
61 -
 62
62 -
63
-
64
-
65
-
66
-
67
-
68
-
69
-
70
-
71
-
72
-
73
-
74
-
75
-
76
-
77
-
78
-
79
-
80
-
81
-
82
-
83
-
84
-
85
-
86
-
87
-
88
-
89
-
90
-
91
-
92
-
93
-
94
-
95
-
96
-
97
-
98
-
99
-
100
-
101
-
102
-
103
-
104
-
105
-
106
-
107
-
108
-
109
-
110
-
111
-
112
-
113
-
114
-
115
-
116
-
117
-
118
-
119
-
120
-
121
-
122
-
123
-
124
-
125
-
126
-
127
-
128
-
129
-
130
-
131
-
132
-
133
-
134
-
135
-
136
-
137
-
138
-
139
-
140
-
141
-
142
-
143
-
144
-
145
-
146
-
147
-
148
-
149
-
150
-
151
-
152
-
153
-
154
-
155
-
156
-
157
-
158
-
159
-
160
-
161
-
162
-
163
-
164
-
165
-
166
-
167
-
168
-
169
-
170
-
171
-
172
-
173
-
174
-
175
-
176
-
177
-
178
-
179
-
180
-
181
-
182
-
183
-
184
-
185
-
186
-
187
-
188
-
189
-
190
-
191
-
192
-
193
-
194
-
195
-
196
-
197
-
198
-
199
-
200
-
201
-
202
-
203
-
204
-
205
-
206
-
207
-
208
-
209
-
210
-
211
-
212
-
213
-
214
-
215
-
216
-
217
-
218
-
219
-
220
-
221
-
222
-
223
-
224
-
225
-
226
-
227
-
228
-
229
-
230
-
231
-
232
-
233
-
234
-
235
-
236
-
237
-
238
-
239
-
240
-
241
-
242
-
243
-
244
-
245
-
246
-
247
-
248
-
249
-
250
-
251
-
252
-
253
-
254
-
255
-
256
-
257
-
258
-
259
-
260
-
261
-
262
-
263
-
264
-
265
-
266
-
267
-
268
-
269
-
270
-
271
-
272
-
273
-
274
-
275
-
276
-
277
-
278
-
279
-
280
-
281
 |
 |

Table of Contents
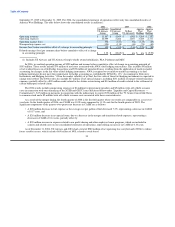
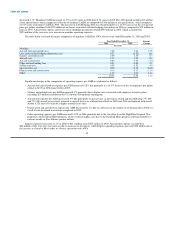
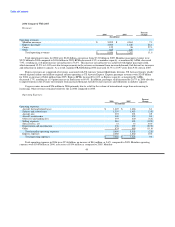
2006 Compared With 2005
Revenues:
Percent
2006 2005 Change
(In millions)
Operating revenues:
Mainline passenger $ 5,205 $ 4,861 7.1
Express passenger 2,084 1,620 28.6
Cargo 122 96 27.1
Other 645 630 2.4
Total operating revenues $ 8,056 $ 7,207 11.8
Total operating revenues for 2006 were $8.06 billion, an increase from $7.21 billion in 2005. Mainline passenger revenues were
$5.21 billion in 2006 compared to $4.86 billion in 2005. RPMs decreased 4.5% as mainline capacity, as measured by ASMs, decreased
7.9%, resulting in a 2.8 point increase in load factor to 78.3%. This increase in load factor was achieved with higher passenger yield,
which increased 12.2% to 14.02 cents due to improvements in the revenue environment from increased demand, fuel driven fare increases
and reductions in industry capacity. As a result, mainline PRASM during 2006 increased 16.3% to 10.97 cents from 9.44 cents in 2005.
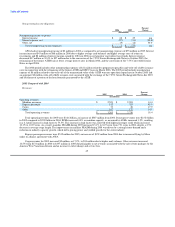
Express revenues are comprised of revenues associated with US Airways' former MidAtlantic division, US Airways Group's wholly
owned regional airlines and affiliate regional airlines operating as US Airways Express. Express passenger revenues were $2.08 billion
for 2006, an increase of $464 million from 2005. Express RPMs increased by 6.6% as Express capacity, as measured by ASMs,
decreased 1.7%, resulting in a 5.4 point increase in load factor to 69.4%. In addition, passenger yield increased by 20.7% in 2006 also due
to improvements in the revenue environment from increased demand, fuel driven fare increases and reductions in industry capacity.
Cargo revenues increased $26 million in 2006 primarily due to a shift in the volume of international cargo from outsourcing to
insourcing. Other revenues remained relatively flat in 2006 compared to 2005.
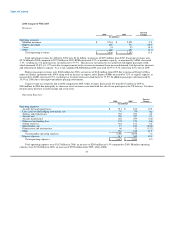
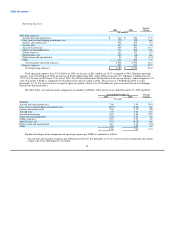
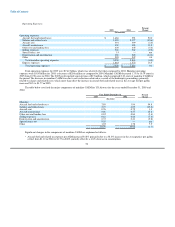
Operating Expenses:
Percent
2006 2005 Change
(In millions)
Operating expenses:
Aircraft fuel and related taxes $ 1,607 $ 1,486 8.1
Salaries and related costs 1,354 1,403 (3.5)
Aircraft rent 393 391 0.5
Aircraft maintenance 340 339 0.3
Other rent and landing fees 393 420 (6.4)
Selling expenses 284 326 (12.9)
Special items, net 21 15 40.0
Depreciation and amortization 138 189 (27.0)
Other 874 989 (11.6)
Total mainline operating expenses 5,404 5,558 (2.8)
Express expenses 2,060 1,862 10.6
Total operating expenses $ 7,464 $ 7,420 0.6
Total operating expenses in 2006 were $7.46 billion, an increase of $44 million, or 0.6%, compared to 2005. Mainline operating
expenses were $5.40 billion in 2006, a decrease of $154 million as compared to 2005. Mainline
49