US Airways 2006 Annual Report Download - page 60
Download and view the complete annual report
Please find page 60 of the 2006 US Airways annual report below. You can navigate through the pages in the report by either clicking on the pages listed below, or by using the keyword search tool below to find specific information within the annual report.-
 1
1 -
2
-
3
-
4
-
5
-
6
-
7
-
8
-
9
-
10
-
11
-
12
-
13
-
14
-
15
-
16
-
17
-
18
-
19
-
20
-
21
-
22
-
23
-
24
-
25
-
26
-
27
-
28
-
29
-
30
-
31
-
32
-
33
-
34
-
35
-
36
-
37
-
38
-
39
-
40
-
41
-
42
-
43
-
44
-
45
-
46
-
47
-
48
-
49
-
 50
50 -
 51
51 -
 52
52 -
 53
53 -
 54
54 -
 55
55 -
 56
56 -
 57
57 -
 58
58 -
 59
59 -
 60
60 -
 61
61 -
 62
62 -
 63
63 -
 64
64 -
 65
65 -
 66
66 -
 67
67 -
 68
68 -
 69
69 -
 70
70 -
71
-
72
-
73
-
74
-
75
-
76
-
77
-
78
-
79
-
80
-
81
-
82
-
83
-
84
-
85
-
86
-
87
-
88
-
89
-
90
-
91
-
92
-
93
-
94
-
95
-
96
-
97
-
98
-
99
-
100
-
101
-
102
-
103
-
104
-
105
-
106
-
107
-
108
-
109
-
110
-
111
-
112
-
113
-
114
-
115
-
116
-
117
-
118
-
119
-
120
-
121
-
122
-
123
-
124
-
125
-
126
-
127
-
128
-
129
-
130
-
131
-
132
-
133
-
134
-
135
-
136
-
137
-
138
-
139
-
140
-
141
-
142
-
143
-
144
-
145
-
146
-
147
-
148
-
149
-
150
-
151
-
152
-
153
-
154
-
155
-
156
-
157
-
158
-
159
-
160
-
161
-
162
-
163
-
164
-
165
-
166
-
167
-
168
-
169
-
170
-
171
-
172
-
173
-
174
-
175
-
176
-
177
-
178
-
179
-
180
-
181
-
182
-
183
-
184
-
185
-
186
-
187
-
188
-
189
-
190
-
191
-
192
-
193
-
194
-
195
-
196
-
197
-
198
-
199
-
200
-
201
-
202
-
203
-
204
-
205
-
206
-
207
-
208
-
209
-
210
-
211
-
212
-
213
-
214
-
215
-
216
-
217
-
218
-
219
-
220
-
221
-
222
-
223
-
224
-
225
-
226
-
227
-
228
-
229
-
230
-
231
-
232
-
233
-
234
-
235
-
236
-
237
-
238
-
239
-
240
-
241
-
242
-
243
-
244
-
245
-
246
-
247
-
248
-
249
-
250
-
251
-
252
-
253
-
254
-
255
-
256
-
257
-
258
-
259
-
260
-
261
-
262
-
263
-
264
-
265
-
266
-
267
-
268
-
269
-
270
-
271
-
272
-
273
-
274
-
275
-
276
-
277
-
278
-
279
-
280
-
281
 |
 |

Table of Contents
US Airways
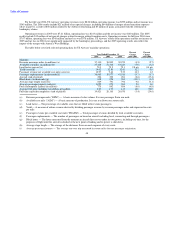
As discussed in "Results of Operations," the financial statements of US Airways prior to September 30, 2005 are not comparable
with the financial statements for the three months ended December 31, 2005. However for purposes of discussion of US Airways' sources
and uses of cash, 2006 has been compared to the combined cash flows of the Successor Company and Predecessor Company for 2005.
As of December 31, 2006, US Airways' cash, cash equivalents, short-term investments and restricted cash were $1.6 billion, of
which $1.2 billion was unrestricted. Net cash provided by operating activities in 2006 was $365 million compared to net cash used in
operating activities of $537 million in 2005. The year over year increase in cash flows from operating activities of $902 million is driven
by the $345 million in net income in 2006 compared to the $160 million net income in 2005, which includes non-cash adjustments of
$697 million from the application of fresh-start accounting in 2005.
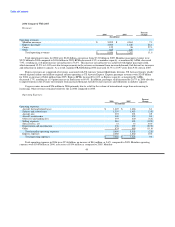
Net cash used in investing activities was $644 million in 2006 compared to net cash provided by of $442 million in 2005. Investing
activities in 2006 included purchases of property and equipment of $146 million, including the purchase of three Boeing 757-200 and two
Embraer 190 aircraft, net purchases of short-term investments of $612 million, and a decrease in restricted cash of $109 million primarily
due to a decrease in reserves required under agreements for processing US Airways' credit card transactions. The 2005 period included
purchases of property and equipment totaling $141 million, including the acquisition of three CRJ-700 aircraft, proceeds of $750 million
from the sale-leaseback of 44 aircraft and other asset sale transactions, net purchases of short-term investments of $132 million and an
increase in restricted cash of $35 million, primarily consisting of reserves required under agreements for processing credit card
transactions.
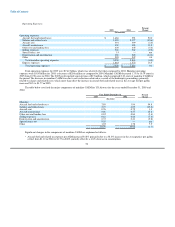
Net cash provided by financing activities in 2006 was $284 million compared to net cash used in financing activities of
$177 million in 2005. Principal financing activities in 2006 included a net increase in payables to related parties of $288 million, the
issuance of $92 million of debt to finance the acquisition of three Boeing 757-200 and two Embraer 190 aircraft, and total debt
repayments of $96 million. The 2005 period included proceeds from the issuance of debt of $265 million. The debt issuance proceeds
included $125 million of debtor-in-possession financing that converted into shares of common stock of US Airways Group upon
emergence from bankruptcy. Debt repayments during 2005 totaled $649 million and included a $394 million reduction in aircraft-related
debt as a result of the flight equipment asset sale-leaseback transactions.
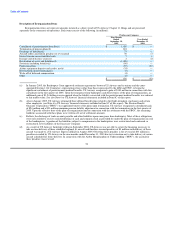
Commitments
As of December 31, 2006, we had $3 billion of long-term debt and capital leases (including current maturities and net of discount
on debt), which consisted primarily of the items discussed below.
Refinancing Transactions
On March 31, 2006, US Airways Group entered into a loan agreement with GECC and a syndicate of lenders pursuant to which we
borrowed an aggregate principal amount of $1.1 billion. On April 7, 2006, US Airways Group entered into an amended and restated loan
agreement, which increased the principal amount of the loan to $1.25 billion. US Airways, America West Holdings, AWA, Piedmont,
PSA and MSC are all guarantors of the GE loan.
The GE loan bears interest at an index rate plus an applicable index margin or, at our option, LIBOR plus an applicable LIBOR
margin for interest periods of one, two, three or six months. The applicable index margin, subject to adjustment, is 1.50%, 2.00%, 2.25%,
or 2.50% if the adjusted loan balance is respectively less than $600 million, between $600 million and $750 million, between
$750 million and $900 million, or between $900 million and $1.25 billion. The applicable LIBOR margin, subject to adjustment, is
2.50%, 3.00%, 3.25%, or 3.50% if the adjusted loan balance is respectively less than $600 million, between $600 million and
$750 million, between $750 million and $900 million, or between $900 million and $1.25 billion. In addition, interest on the GE loan
may be adjusted based on the credit rating for the GE loan as follows: (i) subject to clause (ii) below, if the credit rating for the GE loan is
B1 or better from Moody's and B+ or better from S&P as of the last day of the most recently ended fiscal quarter, then (A) the applicable
LIBOR margin will be the lower of 3.25% and the rate otherwise applicable
57