US Airways 2006 Annual Report Download - page 130
Download and view the complete annual report
Please find page 130 of the 2006 US Airways annual report below. You can navigate through the pages in the report by either clicking on the pages listed below, or by using the keyword search tool below to find specific information within the annual report.-
 1
1 -
2
-
3
-
4
-
5
-
6
-
7
-
8
-
9
-
10
-
11
-
12
-
13
-
14
-
15
-
16
-
17
-
18
-
19
-
20
-
21
-
22
-
23
-
24
-
25
-
26
-
27
-
28
-
29
-
30
-
31
-
32
-
33
-
34
-
35
-
36
-
37
-
38
-
39
-
40
-
41
-
42
-
43
-
44
-
45
-
46
-
47
-
48
-
49
-
50
-
51
-
52
-
53
-
54
-
55
-
56
-
57
-
58
-
59
-
60
-
61
-
62
-
63
-
64
-
65
-
66
-
67
-
68
-
69
-
70
-
71
-
72
-
73
-
74
-
75
-
76
-
77
-
78
-
79
-
80
-
81
-
82
-
83
-
84
-
85
-
86
-
87
-
88
-
89
-
90
-
91
-
92
-
93
-
94
-
95
-
96
-
97
-
98
-
99
-
100
-
101
-
102
-
103
-
104
-
105
-
106
-
107
-
108
-
109
-
110
-
111
-
112
-
113
-
114
-
115
-
116
-
117
-
118
-
119
-
 120
120 -
 121
121 -
 122
122 -
 123
123 -
 124
124 -
 125
125 -
 126
126 -
 127
127 -
 128
128 -
 129
129 -
 130
130 -
 131
131 -
 132
132 -
 133
133 -
 134
134 -
 135
135 -
 136
136 -
 137
137 -
 138
138 -
 139
139 -
 140
140 -
141
-
142
-
143
-
144
-
145
-
146
-
147
-
148
-
149
-
150
-
151
-
152
-
153
-
154
-
155
-
156
-
157
-
158
-
159
-
160
-
161
-
162
-
163
-
164
-
165
-
166
-
167
-
168
-
169
-
170
-
171
-
172
-
173
-
174
-
175
-
176
-
177
-
178
-
179
-
180
-
181
-
182
-
183
-
184
-
185
-
186
-
187
-
188
-
189
-
190
-
191
-
192
-
193
-
194
-
195
-
196
-
197
-
198
-
199
-
200
-
201
-
202
-
203
-
204
-
205
-
206
-
207
-
208
-
209
-
210
-
211
-
212
-
213
-
214
-
215
-
216
-
217
-
218
-
219
-
220
-
221
-
222
-
223
-
224
-
225
-
226
-
227
-
228
-
229
-
230
-
231
-
232
-
233
-
234
-
235
-
236
-
237
-
238
-
239
-
240
-
241
-
242
-
243
-
244
-
245
-
246
-
247
-
248
-
249
-
250
-
251
-
252
-
253
-
254
-
255
-
256
-
257
-
258
-
259
-
260
-
261
-
262
-
263
-
264
-
265
-
266
-
267
-
268
-
269
-
270
-
271
-
272
-
273
-
274
-
275
-
276
-
277
-
278
-
279
-
280
-
281
 |
 |

Table of Contents
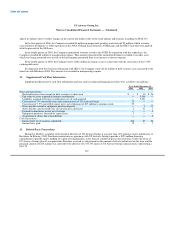
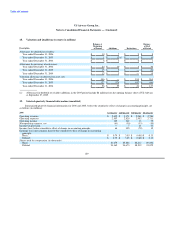
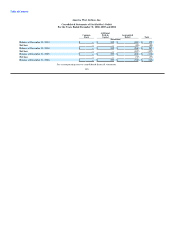
US Airways Group, Inc.
Notes to Consolidated Financial Statements — (Continued)
Weighted
Average
Stock Weighted Remaining Aggregate
Options Average Contractual Term Intrinsic Value
and SARs Exercise Price (years) (in millions)
Balance at December 31, 2004 2,094 $ 15.80
Granted 806 14.52
Exercised (786) 11.37
Forfeited (56) 15.71
Expired (10) 19.85
Balance at December 31, 2005 2,048 $ 16.98
Granted — —
Exercised (1,250) 16.12
Forfeited — —
Expired — —
Balance at December 31, 2006 798 $ 18.33 6.96 $ 28
Vested or expected to vest at December 31, 2006 776 $ 18.25 6.73 $ 28
Exercisable at December 31, 2006 592 $ 17.40 6.39 $ 22
2005 Equity Incentive Plan
Balance at December 31, 2004 — —
Granted 2,034 $ 23.08
Exercised — —
Forfeited (61) 20.64
Expired — —
Balance at December 31, 2005 1,973 $ 23.15
Granted 1,310 40.30
Exercised (701) 24.49
Forfeited (87) 30.34
Expired — —
Balance at December 31, 2006 2,495 $ 31.53 9.09 $ 56
Vested or expected to vest at December 31, 2006 2,254 $ 31.53 9.05 $ 50
Exercisable at December 31, 2006 164 $ 32.79 8.99 $ 3
The fair value of stock options and SARs is determined at the grant date using a Black-Scholes option pricing model, which requires
several assumptions. The risk-free interest rate is based on the U.S. Treasury yield curve in effect for the expected term of the stock
option or SAR at the time of grant. The dividend yield is assumed to be zero since the Company does not pay dividends and has no
current plans to do so in the future. The volatility is based on the historical volatility of US Airways Group common stock over a time
period equal to the expected term of the stock option or SAR. The expected life of stock options and SARs is based on the historical
experience of the Company. 127