US Airways 2006 Annual Report Download - page 111
Download and view the complete annual report
Please find page 111 of the 2006 US Airways annual report below. You can navigate through the pages in the report by either clicking on the pages listed below, or by using the keyword search tool below to find specific information within the annual report.-
 1
1 -
2
-
3
-
4
-
5
-
6
-
7
-
8
-
9
-
10
-
11
-
12
-
13
-
14
-
15
-
16
-
17
-
18
-
19
-
20
-
21
-
22
-
23
-
24
-
25
-
26
-
27
-
28
-
29
-
30
-
31
-
32
-
33
-
34
-
35
-
36
-
37
-
38
-
39
-
40
-
41
-
42
-
43
-
44
-
45
-
46
-
47
-
48
-
49
-
50
-
51
-
52
-
53
-
54
-
55
-
56
-
57
-
58
-
59
-
60
-
61
-
62
-
63
-
64
-
65
-
66
-
67
-
68
-
69
-
70
-
71
-
72
-
73
-
74
-
75
-
76
-
77
-
78
-
79
-
80
-
81
-
82
-
83
-
84
-
85
-
86
-
87
-
88
-
89
-
90
-
91
-
92
-
93
-
94
-
95
-
96
-
97
-
98
-
99
-
100
-
 101
101 -
 102
102 -
 103
103 -
 104
104 -
 105
105 -
 106
106 -
 107
107 -
 108
108 -
 109
109 -
 110
110 -
 111
111 -
 112
112 -
 113
113 -
 114
114 -
 115
115 -
 116
116 -
 117
117 -
 118
118 -
 119
119 -
 120
120 -
 121
121 -
122
-
123
-
124
-
125
-
126
-
127
-
128
-
129
-
130
-
131
-
132
-
133
-
134
-
135
-
136
-
137
-
138
-
139
-
140
-
141
-
142
-
143
-
144
-
145
-
146
-
147
-
148
-
149
-
150
-
151
-
152
-
153
-
154
-
155
-
156
-
157
-
158
-
159
-
160
-
161
-
162
-
163
-
164
-
165
-
166
-
167
-
168
-
169
-
170
-
171
-
172
-
173
-
174
-
175
-
176
-
177
-
178
-
179
-
180
-
181
-
182
-
183
-
184
-
185
-
186
-
187
-
188
-
189
-
190
-
191
-
192
-
193
-
194
-
195
-
196
-
197
-
198
-
199
-
200
-
201
-
202
-
203
-
204
-
205
-
206
-
207
-
208
-
209
-
210
-
211
-
212
-
213
-
214
-
215
-
216
-
217
-
218
-
219
-
220
-
221
-
222
-
223
-
224
-
225
-
226
-
227
-
228
-
229
-
230
-
231
-
232
-
233
-
234
-
235
-
236
-
237
-
238
-
239
-
240
-
241
-
242
-
243
-
244
-
245
-
246
-
247
-
248
-
249
-
250
-
251
-
252
-
253
-
254
-
255
-
256
-
257
-
258
-
259
-
260
-
261
-
262
-
263
-
264
-
265
-
266
-
267
-
268
-
269
-
270
-
271
-
272
-
273
-
274
-
275
-
276
-
277
-
278
-
279
-
280
-
281
 |
 |

Table of Contents
US Airways Group, Inc.
Notes to Consolidated Financial Statements — (Continued)
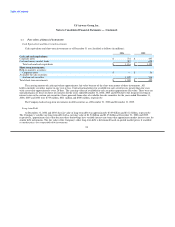
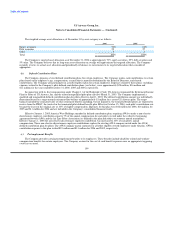
10% in 2006 and 9% in 2007, decreasing to 5% in 2011 and thereafter. The assumed health care cost trend rates could have a significant
effect on amounts reported for retiree health care plans. A one-percentage point change in the health care cost trend rates would have the
following effects on other postretirement benefits as of September 30, 2006 (in millions):
1% Increase 1% Decrease
Effect on total service and interest costs $ — $ —
Effect on postretirement benefit obligation 13 (11)
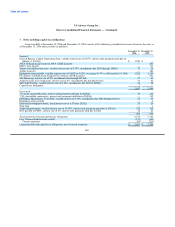
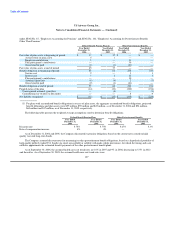
Weighted average assumptions used to determine net periodic benefit cost were as follows:
Defined Benefit Pension Plans Other Postretirement Benefits
Year Ended Year Ended Year Ended Year Ended
December 31, December 31, December 31, December 31,
2006 2005 2006 2005
Discount rate 5.75% 5.75% 5.67% 5.3%
Expected return on plan assets 8% 8% — —
Rate of compensation increase 4% 4% — —
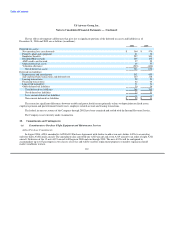
As discussed above, $3 million has been included in accumulated other comprehensive income that has not been recognized in the
net periodic benefit cost of the Company's pension plans and other post retirement benefit plans at December 31, 2006. Components of
the net and total periodic cost for pension and other post retirement benefits (in millions):
Defined Benefit Pension Plans Other Postretirement Benefits
Year Ended Year Ended Year Ended Year Ended
December 31, December 31, December 31, December 31,
2006 2005 2006 2005
Service cost $ 2 $ — $ 4 $ 1
Interest cost 3 1 12 3
Expected return on plan assets (3) (1) — —
Total periodic costs 2 — 16 4
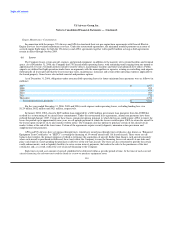
In 2007, the Company expects to contribute $1 million and $29 million to its defined benefit pension plans and other postretirement
plans, respectively. The following benefits, which reflect expected future service, as appropriate, are expected to be paid from the other
postretirement plans (in millions):
Other
Postretirement
Defined Benefit Benefits before
Pension Plans Medicare Subsidy Medicare Subsidy
2007 $ 2 $ 29 $ —
2008 2 27 —
2009 2 23 —
2010 2 21 —
2011 2 18 —
2012 to 2015 17 63 2
The Company assumed that its pension plans' assets would generate a long-term rate of return of 8% at December 31, 2006 and
December 31, 2005. The expected long-term rate of return assumption was developed by evaluating input from the plans' investment
consultants, including their review of asset class return expectations and long-term inflation assumptions.
108