US Airways 2006 Annual Report Download - page 152
Download and view the complete annual report
Please find page 152 of the 2006 US Airways annual report below. You can navigate through the pages in the report by either clicking on the pages listed below, or by using the keyword search tool below to find specific information within the annual report.-
 1
1 -
2
-
3
-
4
-
5
-
6
-
7
-
8
-
9
-
10
-
11
-
12
-
13
-
14
-
15
-
16
-
17
-
18
-
19
-
20
-
21
-
22
-
23
-
24
-
25
-
26
-
27
-
28
-
29
-
30
-
31
-
32
-
33
-
34
-
35
-
36
-
37
-
38
-
39
-
40
-
41
-
42
-
43
-
44
-
45
-
46
-
47
-
48
-
49
-
50
-
51
-
52
-
53
-
54
-
55
-
56
-
57
-
58
-
59
-
60
-
61
-
62
-
63
-
64
-
65
-
66
-
67
-
68
-
69
-
70
-
71
-
72
-
73
-
74
-
75
-
76
-
77
-
78
-
79
-
80
-
81
-
82
-
83
-
84
-
85
-
86
-
87
-
88
-
89
-
90
-
91
-
92
-
93
-
94
-
95
-
96
-
97
-
98
-
99
-
100
-
101
-
102
-
103
-
104
-
105
-
106
-
107
-
108
-
109
-
110
-
111
-
112
-
113
-
114
-
115
-
116
-
117
-
118
-
119
-
120
-
121
-
122
-
123
-
124
-
125
-
126
-
127
-
128
-
129
-
130
-
131
-
132
-
133
-
134
-
135
-
136
-
137
-
138
-
139
-
140
-
141
-
 142
142 -
 143
143 -
 144
144 -
 145
145 -
 146
146 -
 147
147 -
 148
148 -
 149
149 -
 150
150 -
 151
151 -
 152
152 -
 153
153 -
 154
154 -
 155
155 -
 156
156 -
 157
157 -
 158
158 -
 159
159 -
 160
160 -
 161
161 -
 162
162 -
163
-
164
-
165
-
166
-
167
-
168
-
169
-
170
-
171
-
172
-
173
-
174
-
175
-
176
-
177
-
178
-
179
-
180
-
181
-
182
-
183
-
184
-
185
-
186
-
187
-
188
-
189
-
190
-
191
-
192
-
193
-
194
-
195
-
196
-
197
-
198
-
199
-
200
-
201
-
202
-
203
-
204
-
205
-
206
-
207
-
208
-
209
-
210
-
211
-
212
-
213
-
214
-
215
-
216
-
217
-
218
-
219
-
220
-
221
-
222
-
223
-
224
-
225
-
226
-
227
-
228
-
229
-
230
-
231
-
232
-
233
-
234
-
235
-
236
-
237
-
238
-
239
-
240
-
241
-
242
-
243
-
244
-
245
-
246
-
247
-
248
-
249
-
250
-
251
-
252
-
253
-
254
-
255
-
256
-
257
-
258
-
259
-
260
-
261
-
262
-
263
-
264
-
265
-
266
-
267
-
268
-
269
-
270
-
271
-
272
-
273
-
274
-
275
-
276
-
277
-
278
-
279
-
280
-
281
 |
 |
Table of Contents
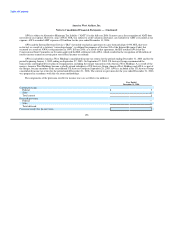
America West Airlines, Inc.
Notes to Consolidated Financial Statements — (Continued)
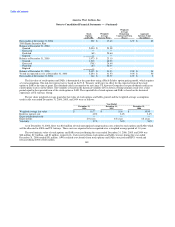
5. Financial Instruments
(a) Fair Value of Financial Instruments
Cash Equivalents and Short-term Investments
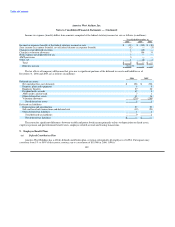
Cash equivalents and short-term investments as of December 31, 2006 and 2005 are classified as follows (in millions):
2006 2005
Cash and cash equivalents:
Corporate notes $ 401 $ 318
Cash and money market funds 219 314
Total cash and cash equivalents $ 620 $ 632
Short-term investments:
Held-to-maturity securities:
Corporate notes $ — $ 56
Available-for-sale securities:
Auction rate securities 506 263
Total short-term investments $ 506 $ 319
The carrying amount of cash equivalents approximates fair value because of the short-term nature of these instruments. All
held-to-maturity securities mature in one year or less. Contractual maturities for available-for-sale securities are greater than ten years
with a reset date approximately every 28 days. The carrying values of available-for-sale securities approximate fair value. There were no
unrealized gains or losses on these investments for the years ended December 31, 2006, 2005 and 2004 due to the frequent resetting of
interest rates on the auction rate securities. Gross proceeds from sales of available-for-sale securities for the years ended December 31,
2006, 2005 and 2004 were $561 million, $349 million and $589 million, respectively.
AWA had no long-term investments in debt securities as of December 31, 2006 and December 31, 2005.
Long-term Debt
At December 31, 2006 and 2005, the fair value of long-term debt was approximately $387 million and $1.04 billion, respectively.
AWA's variable rate long-term debt with a carrying value of $358 million and $911 million at December 31, 2006 and 2005, respectively,
approximates fair value because these borrowings have variable interest rate terms that approximate market interest rates for similar debt
instruments. The fair value of AWA's other long-term debt is determined based on quoted market prices, if available, or market prices for
comparable debt instruments.
(b) Fuel Price Risk Management
Under its fuel hedging program, AWA may enter into certain hedging transactions with approved counterparties for a period
generally not exceeding 12 months. As of December 31, 2006, AWA had entered into costless collar transactions hedging approximately
29% of US Airways Group's projected 2007 fuel requirements. The fair value of AWA's financial derivative instruments was a net
liability of approximately $66 million and a net asset of $4 million at December 31, 2006 and 2005, respectively. As of December 31,
2006, AWA had $48 million of deposits held as collateral on the open fuel hedge positions that are recorded as prepaid expenses and
other on the consolidated balance sheet.
149