US Airways 2006 Annual Report Download - page 54
Download and view the complete annual report
Please find page 54 of the 2006 US Airways annual report below. You can navigate through the pages in the report by either clicking on the pages listed below, or by using the keyword search tool below to find specific information within the annual report.-
 1
1 -
2
-
3
-
4
-
5
-
6
-
7
-
8
-
9
-
10
-
11
-
12
-
13
-
14
-
15
-
16
-
17
-
18
-
19
-
20
-
21
-
22
-
23
-
24
-
25
-
26
-
27
-
28
-
29
-
30
-
31
-
32
-
33
-
34
-
35
-
36
-
37
-
38
-
39
-
40
-
41
-
42
-
43
-
 44
44 -
 45
45 -
 46
46 -
 47
47 -
 48
48 -
 49
49 -
 50
50 -
 51
51 -
 52
52 -
 53
53 -
 54
54 -
 55
55 -
 56
56 -
 57
57 -
 58
58 -
 59
59 -
 60
60 -
 61
61 -
 62
62 -
 63
63 -
 64
64 -
65
-
66
-
67
-
68
-
69
-
70
-
71
-
72
-
73
-
74
-
75
-
76
-
77
-
78
-
79
-
80
-
81
-
82
-
83
-
84
-
85
-
86
-
87
-
88
-
89
-
90
-
91
-
92
-
93
-
94
-
95
-
96
-
97
-
98
-
99
-
100
-
101
-
102
-
103
-
104
-
105
-
106
-
107
-
108
-
109
-
110
-
111
-
112
-
113
-
114
-
115
-
116
-
117
-
118
-
119
-
120
-
121
-
122
-
123
-
124
-
125
-
126
-
127
-
128
-
129
-
130
-
131
-
132
-
133
-
134
-
135
-
136
-
137
-
138
-
139
-
140
-
141
-
142
-
143
-
144
-
145
-
146
-
147
-
148
-
149
-
150
-
151
-
152
-
153
-
154
-
155
-
156
-
157
-
158
-
159
-
160
-
161
-
162
-
163
-
164
-
165
-
166
-
167
-
168
-
169
-
170
-
171
-
172
-
173
-
174
-
175
-
176
-
177
-
178
-
179
-
180
-
181
-
182
-
183
-
184
-
185
-
186
-
187
-
188
-
189
-
190
-
191
-
192
-
193
-
194
-
195
-
196
-
197
-
198
-
199
-
200
-
201
-
202
-
203
-
204
-
205
-
206
-
207
-
208
-
209
-
210
-
211
-
212
-
213
-
214
-
215
-
216
-
217
-
218
-
219
-
220
-
221
-
222
-
223
-
224
-
225
-
226
-
227
-
228
-
229
-
230
-
231
-
232
-
233
-
234
-
235
-
236
-
237
-
238
-
239
-
240
-
241
-
242
-
243
-
244
-
245
-
246
-
247
-
248
-
249
-
250
-
251
-
252
-
253
-
254
-
255
-
256
-
257
-
258
-
259
-
260
-
261
-
262
-
263
-
264
-
265
-
266
-
267
-
268
-
269
-
270
-
271
-
272
-
273
-
274
-
275
-
276
-
277
-
278
-
279
-
280
-
281
 |
 |

Table of Contents
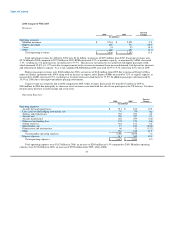
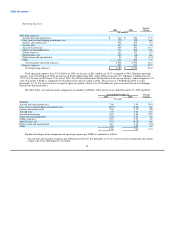
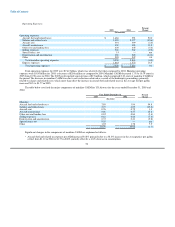
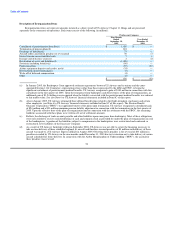
Nonoperating Income (Expense):
Percent
2006 2005 Change
(In millions)
Nonoperating income (expense)
Interest income $ 84 $ 26 nm
Interest expense, net (215) (287) (25.1)
Reorganization items, net — 636 nm
Other, net 13 (4) nm
Total nonoperating income (expense) $ (118) $ 371 nm
US Airways had net nonoperating expense of $118 million in 2006 compared to net nonoperating income of $371 million in 2005.
The change in nonoperating income (expense) is primarily a result of $636 million of net reorganization items recognized in 2005,
representing amounts incurred as a direct result of the Chapter 11 proceedings and gains associated with the discharge of pre-petition
liabilities. See 2005 to 2004 comparison for additional information on the components of reorganization items. Interest income increased
$58 million in 2006 as compared to 2005 due to higher cash balances and higher average interest rates on cash, cash equivalents and
short-term investments and the classification of $7 million of interest income as a reorganization item in the first nine months of 2005.
Interest expense decreased $72 million as a result of reductions in the outstanding debt subsequent to the sale-leaseback transactions
completed in 2005 and that interest expense in the first nine months of 2005 include penalty interest incurred as a result of the bankruptcy
proceedings.
2005 Compared With 2004
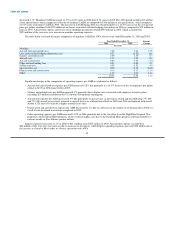
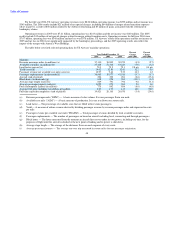
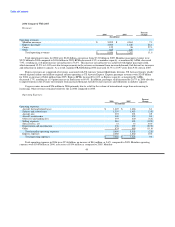
Revenues:
Percent
2005 2004 Change
(In millions)
Operating revenues:
Mainline passenger $ 4,861 $ 4,969 (2.2)
Express passenger 1,620 1,378 17.6
Cargo 96 132 (27.3)
Other 630 589 7.0
Total operating revenues $ 7,207 $ 7,068 2.0
Total operating revenues for 2005 were $7.21 billion, as compared to $7.07 billion in 2004, an increase of 2.0%. Passenger revenue
in the early part of 2005 was negatively impacted by US Airways' bankruptcy proceedings. Mainline passenger revenues declined
$108 million, or 2.2%, as compared to 2004 due to a 2.7% decrease in RPMs, which was partially offset by a 0.6% increase in yield.
ASMs decreased in 2005 by 3.2%, resulting in an increase in load factor from 75.1% to 75.5% and a PRASM increase of 1.2% from 9.33
cents to 9.44 cents.
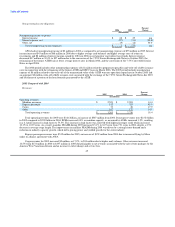
Express passenger revenues were $1.62 billion in 2005, an increase of $242 million or 17.6% from 2004. US Airways Group's
wholly owned subsidiaries and US Airways' former MidAtlantic division, which began service in April 2004, increased RPMs by 66.4%
as compared to 2004, and RPMs flown by affiliate carriers increased 4.0%. The yield for US Airways Express operations decreased 9.4%
as compared to 2004 due to longer stage length and the deployment of regional jets into mainline markets.
Cargo revenues decreased $36 million in 2005 primarily due to lower volume. Other revenues increased 7.0% in 2005 primarily due
to revenue generated through airline partner travel after US Airways joined the Star Alliance in May 2004 and an increase in marketing
revenue related to award miles sold to credit card and other partners.
51