US Airways 2006 Annual Report Download - page 48
Download and view the complete annual report
Please find page 48 of the 2006 US Airways annual report below. You can navigate through the pages in the report by either clicking on the pages listed below, or by using the keyword search tool below to find specific information within the annual report.-
 1
1 -
2
-
3
-
4
-
5
-
6
-
7
-
8
-
9
-
10
-
11
-
12
-
13
-
14
-
15
-
16
-
17
-
18
-
19
-
20
-
21
-
22
-
23
-
24
-
25
-
26
-
27
-
28
-
29
-
30
-
31
-
32
-
33
-
34
-
35
-
36
-
37
-
 38
38 -
 39
39 -
 40
40 -
 41
41 -
 42
42 -
 43
43 -
 44
44 -
 45
45 -
 46
46 -
 47
47 -
 48
48 -
 49
49 -
 50
50 -
 51
51 -
 52
52 -
 53
53 -
 54
54 -
 55
55 -
 56
56 -
 57
57 -
 58
58 -
59
-
60
-
61
-
62
-
63
-
64
-
65
-
66
-
67
-
68
-
69
-
70
-
71
-
72
-
73
-
74
-
75
-
76
-
77
-
78
-
79
-
80
-
81
-
82
-
83
-
84
-
85
-
86
-
87
-
88
-
89
-
90
-
91
-
92
-
93
-
94
-
95
-
96
-
97
-
98
-
99
-
100
-
101
-
102
-
103
-
104
-
105
-
106
-
107
-
108
-
109
-
110
-
111
-
112
-
113
-
114
-
115
-
116
-
117
-
118
-
119
-
120
-
121
-
122
-
123
-
124
-
125
-
126
-
127
-
128
-
129
-
130
-
131
-
132
-
133
-
134
-
135
-
136
-
137
-
138
-
139
-
140
-
141
-
142
-
143
-
144
-
145
-
146
-
147
-
148
-
149
-
150
-
151
-
152
-
153
-
154
-
155
-
156
-
157
-
158
-
159
-
160
-
161
-
162
-
163
-
164
-
165
-
166
-
167
-
168
-
169
-
170
-
171
-
172
-
173
-
174
-
175
-
176
-
177
-
178
-
179
-
180
-
181
-
182
-
183
-
184
-
185
-
186
-
187
-
188
-
189
-
190
-
191
-
192
-
193
-
194
-
195
-
196
-
197
-
198
-
199
-
200
-
201
-
202
-
203
-
204
-
205
-
206
-
207
-
208
-
209
-
210
-
211
-
212
-
213
-
214
-
215
-
216
-
217
-
218
-
219
-
220
-
221
-
222
-
223
-
224
-
225
-
226
-
227
-
228
-
229
-
230
-
231
-
232
-
233
-
234
-
235
-
236
-
237
-
238
-
239
-
240
-
241
-
242
-
243
-
244
-
245
-
246
-
247
-
248
-
249
-
250
-
251
-
252
-
253
-
254
-
255
-
256
-
257
-
258
-
259
-
260
-
261
-
262
-
263
-
264
-
265
-
266
-
267
-
268
-
269
-
270
-
271
-
272
-
273
-
274
-
275
-
276
-
277
-
278
-
279
-
280
-
281
 |
 |

Table of Contents
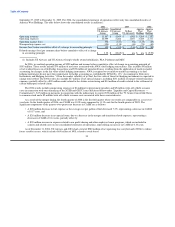
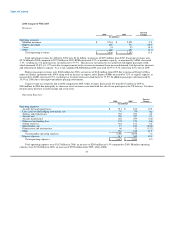
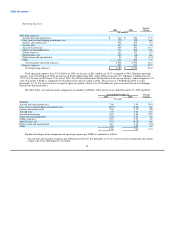
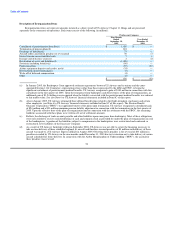
Nonoperating Income (Expense):
Percent
2006 2005 Change
(In millions)
Nonoperating income (expense)
Interest income $ 68 $ 25 nm
Interest expense, net (57) (94) (39.4)
Other, net (9) (6) 50.0
Total nonoperating income (expense) $ 2 $ (75) nm
AWA had net nonoperating income of $2 million in 2006 as compared to net nonoperating expenses of $75 million in 2005. Interest
income increased $43 million to $68 million in 2006 due to higher average cash balances and higher average rates of return on
investments and $8 million of interest income earned by AWA in 2006 on certain prior year federal tax refunds. Interest expense
decreased $37 million or 39.4% to $57 million due to the conversion of the 7.25% Senior Exchangeable Notes in October 2005, the
refinancing of the former ATSB loan at lower average interest rates in March 2006, and the conversion of the 7.5% Convertible Senior
Notes in April 2006.
The 2006 period includes other nonoperating expenses of $11 million related to prepayment penalties and write-off of debt issuance
costs in connection with the refinancing of the former ATSB and GECC loans in March 2006. The 2005 period includes nonoperating
expense of $8 million related to the write-off of the unamortized value of the ATSB warrants upon their repurchase in October 2005 and
an aggregate $2 million write-off of debt issuance costs associated with the exchange of the 7.25% Senior Exchangeable Notes due 2023
and retirement of a portion of the loan formerly guaranteed by the ATSB.
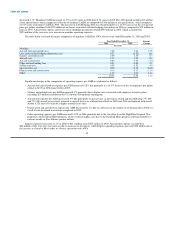
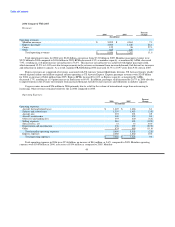
2005 Compared with 2004
Revenues:
Percent
2005 2004 Change
(In millions)
Operating revenues:
Mainline passenger $ 2,521 $ 2,203 14.4
Express passenger 512 353 45.0
Cargo 33 28 17.9
Other 197 172 14.5
Total operating revenues $ 3,263 $ 2,756 18.4
Total operating revenues for 2005 were $3.26 billion, an increase of $507 million from 2004. Passenger revenues were $2.52 billion
in 2005 compared to $2.20 billion in 2004. RPMs increased 4.0% as mainline capacity, as measured by ASMs, increased 1.2%, resulting
in a 2.1 point increase in load factor to 79.5%. This increase in load factor was achieved with higher passenger yield, which increased
10.1% to 10.39 cents. As a result, mainline PRASM during 2005 increased 13.1% to 8.27 cents from 7.31 cents in 2004, despite a 2.3%
decrease in average stage length. The improvement in mainline PRASM during 2005 was driven by a strong leisure demand and a
reduction in industry capacity growth, which led to pricing power and yielded growth for the entire industry.
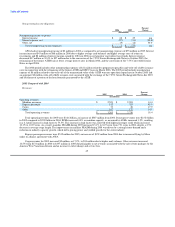
Express passenger revenues were $512 million for 2005, an increase of $159 million from 2004 due to increased flying by Mesa
under its alliance agreement with AWA.
Cargo revenues for 2005 increased $5 million, or 17.9%, to $33 million due to higher mail volumes. Other revenues increased
14.5% from $172 million in 2004 to $197 million in 2005 due principally to net revenues associated with the sale of tour packages by the
America West Vacations division and an increase in ticket change and service fees.
45