US Airways 2006 Annual Report Download - page 49
Download and view the complete annual report
Please find page 49 of the 2006 US Airways annual report below. You can navigate through the pages in the report by either clicking on the pages listed below, or by using the keyword search tool below to find specific information within the annual report.-
 1
1 -
2
-
3
-
4
-
5
-
6
-
7
-
8
-
9
-
10
-
11
-
12
-
13
-
14
-
15
-
16
-
17
-
18
-
19
-
20
-
21
-
22
-
23
-
24
-
25
-
26
-
27
-
28
-
29
-
30
-
31
-
32
-
33
-
34
-
35
-
36
-
37
-
38
-
 39
39 -
 40
40 -
 41
41 -
 42
42 -
 43
43 -
 44
44 -
 45
45 -
 46
46 -
 47
47 -
 48
48 -
 49
49 -
 50
50 -
 51
51 -
 52
52 -
 53
53 -
 54
54 -
 55
55 -
 56
56 -
 57
57 -
 58
58 -
 59
59 -
60
-
61
-
62
-
63
-
64
-
65
-
66
-
67
-
68
-
69
-
70
-
71
-
72
-
73
-
74
-
75
-
76
-
77
-
78
-
79
-
80
-
81
-
82
-
83
-
84
-
85
-
86
-
87
-
88
-
89
-
90
-
91
-
92
-
93
-
94
-
95
-
96
-
97
-
98
-
99
-
100
-
101
-
102
-
103
-
104
-
105
-
106
-
107
-
108
-
109
-
110
-
111
-
112
-
113
-
114
-
115
-
116
-
117
-
118
-
119
-
120
-
121
-
122
-
123
-
124
-
125
-
126
-
127
-
128
-
129
-
130
-
131
-
132
-
133
-
134
-
135
-
136
-
137
-
138
-
139
-
140
-
141
-
142
-
143
-
144
-
145
-
146
-
147
-
148
-
149
-
150
-
151
-
152
-
153
-
154
-
155
-
156
-
157
-
158
-
159
-
160
-
161
-
162
-
163
-
164
-
165
-
166
-
167
-
168
-
169
-
170
-
171
-
172
-
173
-
174
-
175
-
176
-
177
-
178
-
179
-
180
-
181
-
182
-
183
-
184
-
185
-
186
-
187
-
188
-
189
-
190
-
191
-
192
-
193
-
194
-
195
-
196
-
197
-
198
-
199
-
200
-
201
-
202
-
203
-
204
-
205
-
206
-
207
-
208
-
209
-
210
-
211
-
212
-
213
-
214
-
215
-
216
-
217
-
218
-
219
-
220
-
221
-
222
-
223
-
224
-
225
-
226
-
227
-
228
-
229
-
230
-
231
-
232
-
233
-
234
-
235
-
236
-
237
-
238
-
239
-
240
-
241
-
242
-
243
-
244
-
245
-
246
-
247
-
248
-
249
-
250
-
251
-
252
-
253
-
254
-
255
-
256
-
257
-
258
-
259
-
260
-
261
-
262
-
263
-
264
-
265
-
266
-
267
-
268
-
269
-
270
-
271
-
272
-
273
-
274
-
275
-
276
-
277
-
278
-
279
-
280
-
281
 |
 |
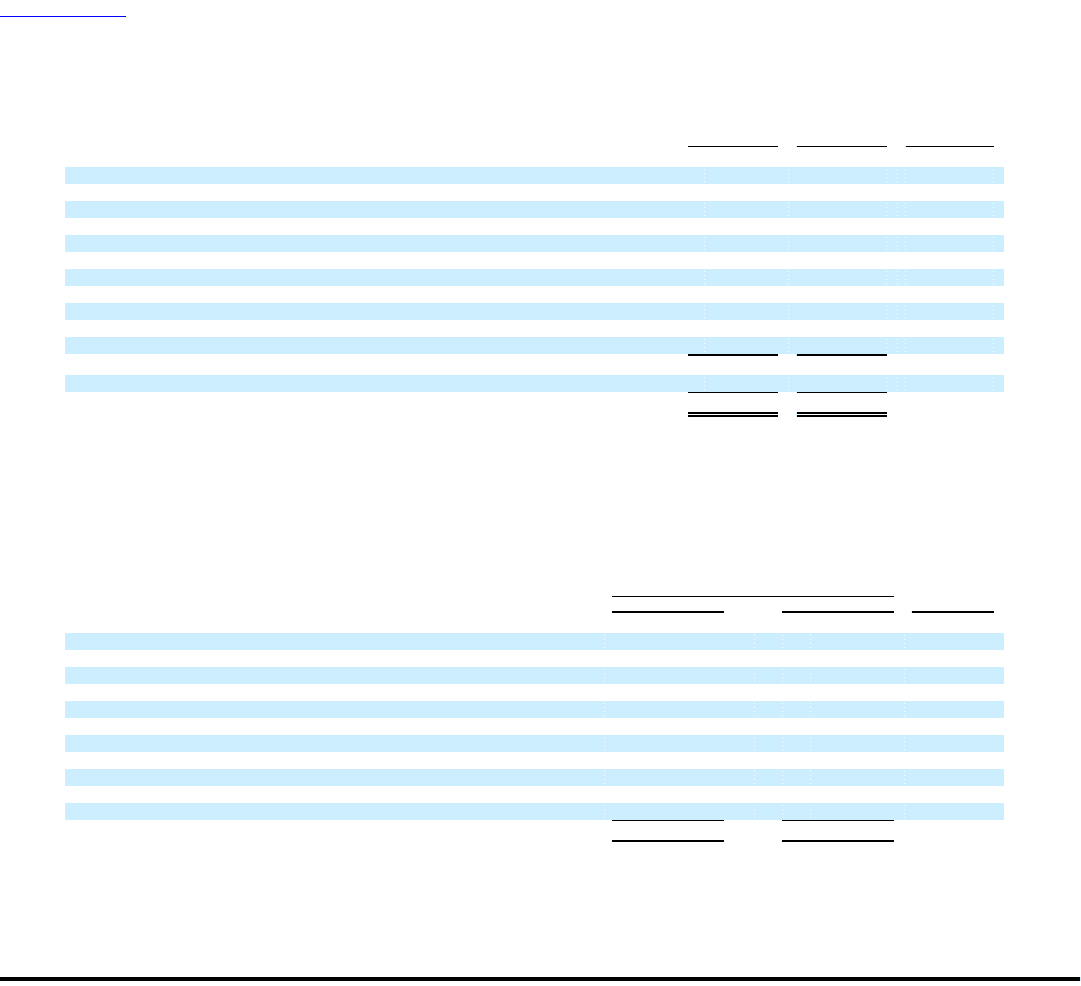
Table of Contents
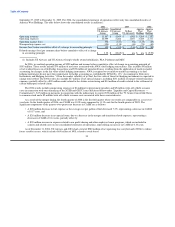
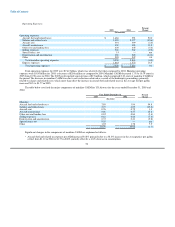
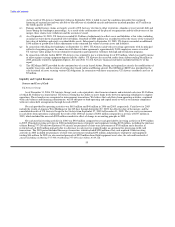
Operating Expenses:
Percent
2005 2004 Change
(In millions)
Operating expenses:
Aircraft fuel and related taxes $ 812 $ 590 37.6
Loss (gain) on fuel hedging instruments, net (75) (24) nm
Salaries and related costs 701 655 7.0
Aircraft rent 327 304 7.6
Aircraft maintenance 259 206 25.7
Other rent and landing fees 176 168 4.8
Selling expenses 161 153 5.2
Special items, net 106 (16) nm
Depreciation and amortization 53 54 (1.9)
Other 318 308 3.3
Total mainline operating expenses 2,838 2,398 18.4
Express expenses 545 374 45.7
Total operating expenses $ 3,383 $ 2,772 22.0
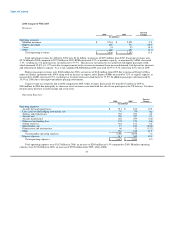
Total operating expenses were $3.38 billion in 2005, an increase of $611 million or 22.0% compared to 2004. Mainline operating
expenses were $2.84 billion in 2005, an increase of $440 million from 2004, while ASMs increased 1.2%. Mainline CASM increased
17.0% to 9.30 cents in 2005 from 7.95 cents in 2004. The 2005 period includes $106 million of net special charges, which comprises 0.35
cents of mainline CASM, as compared to $16 million of net special credits in 2004. The increase in CASM during 2005 was due
principally to a 37.4% increase in the average fuel price per gallon, offset by the $75 million net gain associated with the fuel hedging
transactions discussed above.
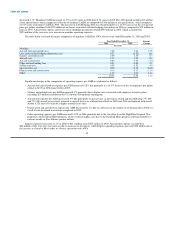
The table below sets forth the major components of mainline CASM for AWA for the years ended December 31, 2005 and 2004:
Year Ended December 31, Percent
2005 2004 Change
(In cents)
Mainline:
Aircraft fuel and related taxes 2.66 1.95 36.0
Loss (gain) on fuel hedging instruments, net (0.25) (0.08) nm
Salaries and related costs 2.30 2.17 5.8
Aircraft rent 1.07 1.01 6.3
Aircraft maintenance 0.85 0.68 24.5
Other rent and landing fees 0.58 0.56 3.8
Selling expenses 0.53 0.51 4.2
Special items, net 0.35 (0.05) nm
Depreciation and amortization 0.17 0.18 (3.6)
Other 1.04 1.02 2.0
9.30 7.95 17.0
Significant changes in the components of operating expense per ASM are explained as follows:
• Aircraft fuel and related tax expense per ASM increased 36.0% due primarily to a 37.4% increase in the average price per gallon
of fuel to $1.80 in 2005 from $1.31 in 2004.
46