US Airways 2006 Annual Report Download - page 47
Download and view the complete annual report
Please find page 47 of the 2006 US Airways annual report below. You can navigate through the pages in the report by either clicking on the pages listed below, or by using the keyword search tool below to find specific information within the annual report.-
 1
1 -
2
-
3
-
4
-
5
-
6
-
7
-
8
-
9
-
10
-
11
-
12
-
13
-
14
-
15
-
16
-
17
-
18
-
19
-
20
-
21
-
22
-
23
-
24
-
25
-
26
-
27
-
28
-
29
-
30
-
31
-
32
-
33
-
34
-
35
-
36
-
 37
37 -
 38
38 -
 39
39 -
 40
40 -
 41
41 -
 42
42 -
 43
43 -
 44
44 -
 45
45 -
 46
46 -
 47
47 -
 48
48 -
 49
49 -
 50
50 -
 51
51 -
 52
52 -
 53
53 -
 54
54 -
 55
55 -
 56
56 -
 57
57 -
58
-
59
-
60
-
61
-
62
-
63
-
64
-
65
-
66
-
67
-
68
-
69
-
70
-
71
-
72
-
73
-
74
-
75
-
76
-
77
-
78
-
79
-
80
-
81
-
82
-
83
-
84
-
85
-
86
-
87
-
88
-
89
-
90
-
91
-
92
-
93
-
94
-
95
-
96
-
97
-
98
-
99
-
100
-
101
-
102
-
103
-
104
-
105
-
106
-
107
-
108
-
109
-
110
-
111
-
112
-
113
-
114
-
115
-
116
-
117
-
118
-
119
-
120
-
121
-
122
-
123
-
124
-
125
-
126
-
127
-
128
-
129
-
130
-
131
-
132
-
133
-
134
-
135
-
136
-
137
-
138
-
139
-
140
-
141
-
142
-
143
-
144
-
145
-
146
-
147
-
148
-
149
-
150
-
151
-
152
-
153
-
154
-
155
-
156
-
157
-
158
-
159
-
160
-
161
-
162
-
163
-
164
-
165
-
166
-
167
-
168
-
169
-
170
-
171
-
172
-
173
-
174
-
175
-
176
-
177
-
178
-
179
-
180
-
181
-
182
-
183
-
184
-
185
-
186
-
187
-
188
-
189
-
190
-
191
-
192
-
193
-
194
-
195
-
196
-
197
-
198
-
199
-
200
-
201
-
202
-
203
-
204
-
205
-
206
-
207
-
208
-
209
-
210
-
211
-
212
-
213
-
214
-
215
-
216
-
217
-
218
-
219
-
220
-
221
-
222
-
223
-
224
-
225
-
226
-
227
-
228
-
229
-
230
-
231
-
232
-
233
-
234
-
235
-
236
-
237
-
238
-
239
-
240
-
241
-
242
-
243
-
244
-
245
-
246
-
247
-
248
-
249
-
250
-
251
-
252
-
253
-
254
-
255
-
256
-
257
-
258
-
259
-
260
-
261
-
262
-
263
-
264
-
265
-
266
-
267
-
268
-
269
-
270
-
271
-
272
-
273
-
274
-
275
-
276
-
277
-
278
-
279
-
280
-
281
 |
 |
Table of Contents
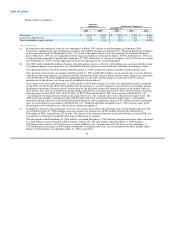
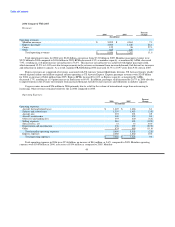
decreased 3.1%. Mainline CASM increased 11.3% to 10.35 cents in 2006 from 9.30 cents in 2005. The 2006 period includes $17 million
of net special items, which comprises 0.06 cents of mainline CASM, as compared to $106 million of net special items, which comprises
of 0.35 cents of mainline CASM in 2005. The increase in CASM during 2006 was due principally to a 16.5% increase in the average fuel
price per gallon, combined with $79 million of net losses associated with fuel hedging transactions in 2006 as compared to $75 million in
gains in 2005. Aircraft fuel expense and losses on fuel hedging instruments totaled $990 million in 2006, which accounted for
$253 million of the year-over-year increase in mainline operating expenses.
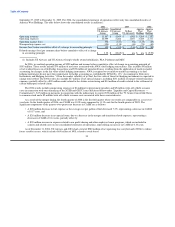
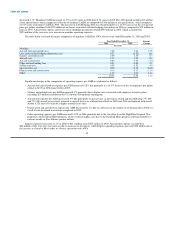
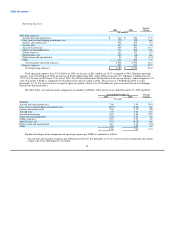
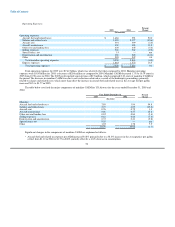
The table below sets forth the major components of mainline CASM for AWA for the years ended December 31, 2006 and 2005:
Year Ended December 31, Percent
2006 2005 Change
(In cents)
Mainline:
Aircraft fuel and related taxes 3.08 2.66 15.8
Loss (gain) on fuel hedging instruments, net 0.27 (0.25) nm
Salaries and related costs 2.49 2.30 8.3
Aircraft rent 1.15 1.07 6.9
Aircraft maintenance 0.82 0.85 (3.6)
Other rent and landing fees 0.59 0.58 2.9
Selling expenses 0.55 0.53 4.0
Special items, net 0.06 0.35 (83.6)
Depreciation and amortization 0.15 0.17 (11.1)
Other 1.19 1.04 14.4
10.35 9.30 11.3
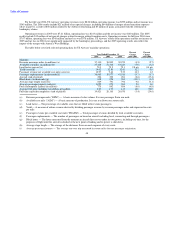
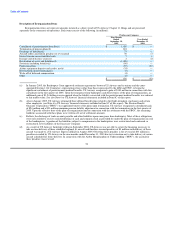
Significant changes in the components of operating expense per ASM are explained as follows:
• Aircraft fuel and related tax expense per ASM increased 15.8% due primarily to a 16.5% increase in the average price per gallon
of fuel to $2.09 in 2006 from $1.80 in 2005.
• Salaries and related costs per ASM increased 8.3% primarily due to higher costs associated with employee incentive plans,
including $23 million recorded for the US Airways Group profit sharing plan.
• Aircraft rent expense per ASM increased 6.9% due principally to aircraft mix, as previously owned and leased Boeing 737-200
and 737-300 aircraft were retired, returned to aircraft lessors or sold and leased back in 2005 and 2006 and replaced with leased
Airbus A320 and A319 aircraft at higher monthly lease rates.
• Depreciation and amortization expense per ASM decreased 11.1% due to a decrease in the number of owned aircraft in 2006 as a
result of sale-leaseback transactions completed in 2005.
• Other operating expenses per ASM increased 14.4% in 2006 primarily due to the transition from the FlightFund frequent flyer
program to the Dividend Miles program, which results in higher costs due to the Dividend Miles program allowing members to
redeem awards on Star Alliance partner airlines.
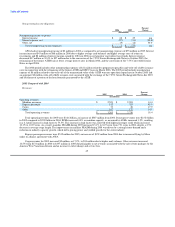
Express expenses increased 12.1% in 2006 to $611 million from $545 million in 2005. Aircraft fuel expense accounted for
$28 million of the year-over-year increase due to increases in fuel prices, while Express operating expenses increased $38 million due to
the increase in flying by Mesa under its alliance agreement with AWA.
44