US Airways 2006 Annual Report Download - page 212
Download and view the complete annual report
Please find page 212 of the 2006 US Airways annual report below. You can navigate through the pages in the report by either clicking on the pages listed below, or by using the keyword search tool below to find specific information within the annual report.-
 1
1 -
2
-
3
-
4
-
5
-
6
-
7
-
8
-
9
-
10
-
11
-
12
-
13
-
14
-
15
-
16
-
17
-
18
-
19
-
20
-
21
-
22
-
23
-
24
-
25
-
26
-
27
-
28
-
29
-
30
-
31
-
32
-
33
-
34
-
35
-
36
-
37
-
38
-
39
-
40
-
41
-
42
-
43
-
44
-
45
-
46
-
47
-
48
-
49
-
50
-
51
-
52
-
53
-
54
-
55
-
56
-
57
-
58
-
59
-
60
-
61
-
62
-
63
-
64
-
65
-
66
-
67
-
68
-
69
-
70
-
71
-
72
-
73
-
74
-
75
-
76
-
77
-
78
-
79
-
80
-
81
-
82
-
83
-
84
-
85
-
86
-
87
-
88
-
89
-
90
-
91
-
92
-
93
-
94
-
95
-
96
-
97
-
98
-
99
-
100
-
101
-
102
-
103
-
104
-
105
-
106
-
107
-
108
-
109
-
110
-
111
-
112
-
113
-
114
-
115
-
116
-
117
-
118
-
119
-
120
-
121
-
122
-
123
-
124
-
125
-
126
-
127
-
128
-
129
-
130
-
131
-
132
-
133
-
134
-
135
-
136
-
137
-
138
-
139
-
140
-
141
-
142
-
143
-
144
-
145
-
146
-
147
-
148
-
149
-
150
-
151
-
152
-
153
-
154
-
155
-
156
-
157
-
158
-
159
-
160
-
161
-
162
-
163
-
164
-
165
-
166
-
167
-
168
-
169
-
170
-
171
-
172
-
173
-
174
-
175
-
176
-
177
-
178
-
179
-
180
-
181
-
182
-
183
-
184
-
185
-
186
-
187
-
188
-
189
-
190
-
191
-
192
-
193
-
194
-
195
-
196
-
197
-
198
-
199
-
200
-
201
-
 202
202 -
 203
203 -
 204
204 -
 205
205 -
 206
206 -
 207
207 -
 208
208 -
 209
209 -
 210
210 -
 211
211 -
 212
212 -
 213
213 -
 214
214 -
 215
215 -
 216
216 -
 217
217 -
 218
218 -
 219
219 -
 220
220 -
 221
221 -
 222
222 -
223
-
224
-
225
-
226
-
227
-
228
-
229
-
230
-
231
-
232
-
233
-
234
-
235
-
236
-
237
-
238
-
239
-
240
-
241
-
242
-
243
-
244
-
245
-
246
-
247
-
248
-
249
-
250
-
251
-
252
-
253
-
254
-
255
-
256
-
257
-
258
-
259
-
260
-
261
-
262
-
263
-
264
-
265
-
266
-
267
-
268
-
269
-
270
-
271
-
272
-
273
-
274
-
275
-
276
-
277
-
278
-
279
-
280
-
281
 |
 |

Table of Contents
US Airways, Inc.
Notes to the Financial Statements — (Continued)
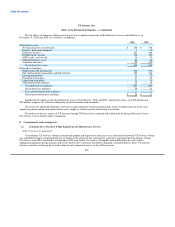
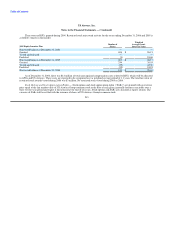
US Airways also reflect shared expenses incurred at more than 30 overlap airports where the operations of US Airways and AWA have
been consolidated. These shared costs have been allocated based on US Airways' and AWA's respective departures at those airports.
Management believes that the methodologies underlying the allocation of these shared costs are reasonable. The following details the
total corporate shared expenses and airport shared expenses allocated to US Airways and AWA that are included in operating expenses
for the year ended December 31, 2006 (in millions):
Year Ended
December 31, 2006
AWA US Airways Total
Corporate Expenses $ 167 $ 266 $ 433
Airport Expenses 112 197 309
Total Allocated Expenses $ 279 $ 463 $ 742
11. Stockholder's Equity and Dividend Restrictions
US Airways Group owns all of US Airways' outstanding common stock, par value $1 per share. US Airways' board of directors has
not authorized the payment of dividends on the common stock since 1988.
US Airways, organized under the laws of the State of Delaware, is subject to Sections 160 and 170 of the Delaware General
Corporation Law with respect to the payment of dividends on or the repurchase or redemption of its capital stock. US Airways is
restricted from engaging in any of these activities unless it maintains a capital surplus. In addition, US Airways may not pay dividends in
accordance with provisions contained in the GE Loan.
12. Nonoperating Income (Expenses) — Other, Net
In 2006 and 2005, US Airways recorded $11 million and $4 million, respectively, of derivative gains attributable to stock options in
Sabre and warrants in a number of companies. On an ongoing basis, US Airways adjusts its balance sheet to reflect changes in the current
fair market value of the stock options and warrants according to SFAS 133.
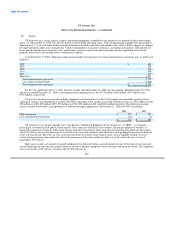
13. Operating Segments and Related Disclosures
US Airways Group is managed as a single business unit that provides air transportation for passengers and cargo. This allows it to
benefit from an integrated revenue pricing and route network that includes US Airways, AWA, Piedmont, PSA and third-party carriers
that fly under capacity purchase agreements as part of US Airways Express. The flight equipment of all these carriers is combined to
form one fleet that is deployed through a single route scheduling system. When making resource allocation decisions, the chief operating
decision maker evaluates flight profitability data, which considers aircraft type and route economics, but gives no weight to the financial
impact of the resource allocation decision on an individual carrier basis. The objective in making resource allocation decisions is to
maximize consolidated financial results, not the individual results of US Airways, AWA, Piedmont and PSA.
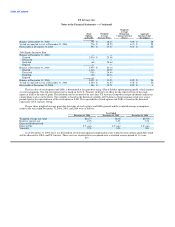
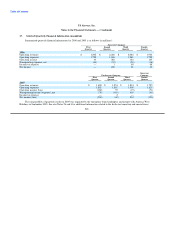
Information concerning operating revenues in principal geographic areas is as follows (in millions):
Successor Company Predecessor Company
Three Months Nine Months
Year Ended Ended Ended Year Ended
December 31, 2006 December 31, 2005 September 30, 2005 December 31, 2004
United States $ 6.232 $ 1,501 $ 4,508 $ 5,220
Foreign 1.824 254 944 1,848
Total $ 8.056 $ 1,755 $ 5,452 $ 7,068
209