US Airways 2006 Annual Report Download - page 199
Download and view the complete annual report
Please find page 199 of the 2006 US Airways annual report below. You can navigate through the pages in the report by either clicking on the pages listed below, or by using the keyword search tool below to find specific information within the annual report.-
 1
1 -
2
-
3
-
4
-
5
-
6
-
7
-
8
-
9
-
10
-
11
-
12
-
13
-
14
-
15
-
16
-
17
-
18
-
19
-
20
-
21
-
22
-
23
-
24
-
25
-
26
-
27
-
28
-
29
-
30
-
31
-
32
-
33
-
34
-
35
-
36
-
37
-
38
-
39
-
40
-
41
-
42
-
43
-
44
-
45
-
46
-
47
-
48
-
49
-
50
-
51
-
52
-
53
-
54
-
55
-
56
-
57
-
58
-
59
-
60
-
61
-
62
-
63
-
64
-
65
-
66
-
67
-
68
-
69
-
70
-
71
-
72
-
73
-
74
-
75
-
76
-
77
-
78
-
79
-
80
-
81
-
82
-
83
-
84
-
85
-
86
-
87
-
88
-
89
-
90
-
91
-
92
-
93
-
94
-
95
-
96
-
97
-
98
-
99
-
100
-
101
-
102
-
103
-
104
-
105
-
106
-
107
-
108
-
109
-
110
-
111
-
112
-
113
-
114
-
115
-
116
-
117
-
118
-
119
-
120
-
121
-
122
-
123
-
124
-
125
-
126
-
127
-
128
-
129
-
130
-
131
-
132
-
133
-
134
-
135
-
136
-
137
-
138
-
139
-
140
-
141
-
142
-
143
-
144
-
145
-
146
-
147
-
148
-
149
-
150
-
151
-
152
-
153
-
154
-
155
-
156
-
157
-
158
-
159
-
160
-
161
-
162
-
163
-
164
-
165
-
166
-
167
-
168
-
169
-
170
-
171
-
172
-
173
-
174
-
175
-
176
-
177
-
178
-
179
-
180
-
181
-
182
-
183
-
184
-
185
-
186
-
187
-
188
-
 189
189 -
 190
190 -
 191
191 -
 192
192 -
 193
193 -
 194
194 -
 195
195 -
 196
196 -
 197
197 -
 198
198 -
 199
199 -
 200
200 -
 201
201 -
 202
202 -
 203
203 -
 204
204 -
 205
205 -
 206
206 -
 207
207 -
 208
208 -
 209
209 -
210
-
211
-
212
-
213
-
214
-
215
-
216
-
217
-
218
-
219
-
220
-
221
-
222
-
223
-
224
-
225
-
226
-
227
-
228
-
229
-
230
-
231
-
232
-
233
-
234
-
235
-
236
-
237
-
238
-
239
-
240
-
241
-
242
-
243
-
244
-
245
-
246
-
247
-
248
-
249
-
250
-
251
-
252
-
253
-
254
-
255
-
256
-
257
-
258
-
259
-
260
-
261
-
262
-
263
-
264
-
265
-
266
-
267
-
268
-
269
-
270
-
271
-
272
-
273
-
274
-
275
-
276
-
277
-
278
-
279
-
280
-
281
 |
 |

Table of Contents
US Airways, Inc.
Notes to the Financial Statements — (Continued)
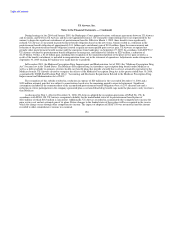
US Airways' September 30, 2006 and 2005 assumed discount rates of 5.67% and 5.30%, respectively for measuring its other
postretirement benefit obligations are based on a hypothetical portfolio of high quality publicly traded U.S. bonds (Aa rated, non-callable
or callable with make-whole provisions), for which the timing and cash outflows approximate the estimated benefit payments of the other
postretirement benefit plans.
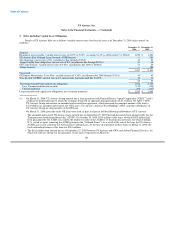
As of September 30, 2006, the assumed health care cost trend rates are 10% in 2007 and 9% in 2008, decreasing to 5.5% in 2012
and thereafter. As of September 30, 2005, the assumed health care cost trend rates were 10% in 2006 and 9% in 2007, decreasing to 5%
in 2011 and thereafter. The assumed health care cost trend rates could have a significant effect on amounts reported for retiree health care
plans. A one-percentage point change in the health care cost trend rates would have the following effects on other postretirement benefits
as of September 30, 2006 (in millions):
1% Increase 1% Decrease
Effect on postretirement benefit obligation $ 13 $ (11)
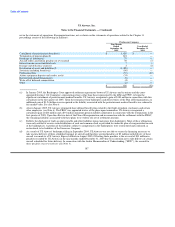
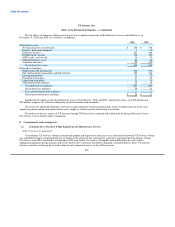
Weighted average assumptions used to determine net periodic benefit cost were as follows:
Defined Benefit Pension Plans Other Postretirement Benefits
Predecessor Company Successor Company Predecessor Company
Nine Months Three Months Nine Months
Ended Year Ended Year Ended Ended Ended Year Ended
September 30, December 31, December 31, December 31, September 30, December 31,
2005 2004 2006 2005 2005 2004
Discount rate 6.00% 6.00% 5.67% 5.30% 5.80% 6.19%
Expected return on
plan assets 7.33% 8.00% — — — —
Rate of compensation increase 3.73% 3.73% — — — —
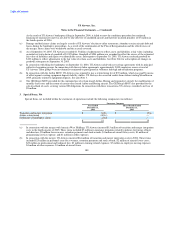
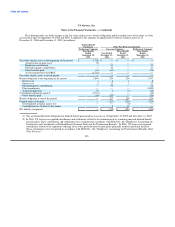
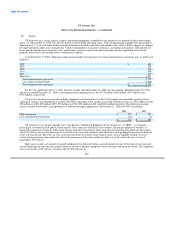
Components of the net and total periodic cost for pension benefits (in millions):
Predecessor Company
Nine Months
Ended Year Ended
September 30, December 31,
2005 2004
Service cost $ 1 $ 40
Interest cost 6 152
Expected return on plan assets (5) (128)
Amortization of:
Prior service cost — —
Actuarial loss — —
Net periodic cost 2 64
Curtailment/settlement gains (801) —
Fresh-start loss — —
Total periodic cost $ (799) $ 64
196