US Airways 2006 Annual Report Download - page 41
Download and view the complete annual report
Please find page 41 of the 2006 US Airways annual report below. You can navigate through the pages in the report by either clicking on the pages listed below, or by using the keyword search tool below to find specific information within the annual report.-
 1
1 -
2
-
3
-
4
-
5
-
6
-
7
-
8
-
9
-
10
-
11
-
12
-
13
-
14
-
15
-
16
-
17
-
18
-
19
-
20
-
21
-
22
-
23
-
24
-
25
-
26
-
27
-
28
-
29
-
30
-
 31
31 -
 32
32 -
 33
33 -
 34
34 -
 35
35 -
 36
36 -
 37
37 -
 38
38 -
 39
39 -
 40
40 -
 41
41 -
 42
42 -
 43
43 -
 44
44 -
 45
45 -
 46
46 -
 47
47 -
 48
48 -
 49
49 -
 50
50 -
 51
51 -
52
-
53
-
54
-
55
-
56
-
57
-
58
-
59
-
60
-
61
-
62
-
63
-
64
-
65
-
66
-
67
-
68
-
69
-
70
-
71
-
72
-
73
-
74
-
75
-
76
-
77
-
78
-
79
-
80
-
81
-
82
-
83
-
84
-
85
-
86
-
87
-
88
-
89
-
90
-
91
-
92
-
93
-
94
-
95
-
96
-
97
-
98
-
99
-
100
-
101
-
102
-
103
-
104
-
105
-
106
-
107
-
108
-
109
-
110
-
111
-
112
-
113
-
114
-
115
-
116
-
117
-
118
-
119
-
120
-
121
-
122
-
123
-
124
-
125
-
126
-
127
-
128
-
129
-
130
-
131
-
132
-
133
-
134
-
135
-
136
-
137
-
138
-
139
-
140
-
141
-
142
-
143
-
144
-
145
-
146
-
147
-
148
-
149
-
150
-
151
-
152
-
153
-
154
-
155
-
156
-
157
-
158
-
159
-
160
-
161
-
162
-
163
-
164
-
165
-
166
-
167
-
168
-
169
-
170
-
171
-
172
-
173
-
174
-
175
-
176
-
177
-
178
-
179
-
180
-
181
-
182
-
183
-
184
-
185
-
186
-
187
-
188
-
189
-
190
-
191
-
192
-
193
-
194
-
195
-
196
-
197
-
198
-
199
-
200
-
201
-
202
-
203
-
204
-
205
-
206
-
207
-
208
-
209
-
210
-
211
-
212
-
213
-
214
-
215
-
216
-
217
-
218
-
219
-
220
-
221
-
222
-
223
-
224
-
225
-
226
-
227
-
228
-
229
-
230
-
231
-
232
-
233
-
234
-
235
-
236
-
237
-
238
-
239
-
240
-
241
-
242
-
243
-
244
-
245
-
246
-
247
-
248
-
249
-
250
-
251
-
252
-
253
-
254
-
255
-
256
-
257
-
258
-
259
-
260
-
261
-
262
-
263
-
264
-
265
-
266
-
267
-
268
-
269
-
270
-
271
-
272
-
273
-
274
-
275
-
276
-
277
-
278
-
279
-
280
-
281
 |
 |

Table of Contents
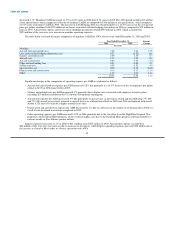
carriers, particularly as the benefits of our cost synergies are realized. See the US Airways Group, AWA and US Airways Results of
Operations sections within Item 7 of this report for analysis related to CASM.
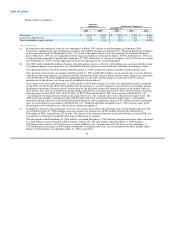
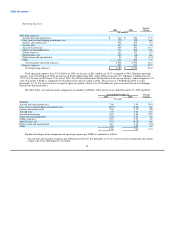
Revenue Pricing Environment
The revenue environment improved dramatically during 2006 as our mainline passenger revenue per available seat mile
("PRASM") was 10.35 cents in 2006. For the fourth quarter of 2006, the first full quarter where US Airways Group's results were
comparable on a year-over-year basis, US Airways Group's mainline PRASM increased to 10.12 cents compared to PRASM in the 2005
period of 9.32 cents. For the full year 2006, AWA's mainline PRASM increased 12.9% to 9.34 cents in 2006 from 8.27 cents in 2005.
US Airways' mainline PRASM increased 16.3% to 10.97 cents in 2006 from 9.44 cents in 2005. The improvement in mainline PRASM
during 2006 was driven by: (1) rational industry capacity growth, which led to pricing power and yield growth for the entire industry;
(2) strong leisure demand; and (3) realization of some of the synergy benefits from the merger, including our fare restructuring, the
implementation of a code share agreement between AWA and US Airways that helped each airline sell more tickets, an improved and
combined frequent flyer program and a rationalized route network that eliminated capacity on our weakest routes.
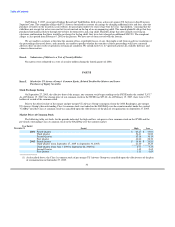
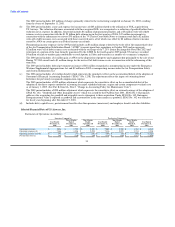
Customer Service
We are committed to building a successful combined airline by taking care of our customers. We believe that our focus on excellent
customer service in every aspect of our operations including personnel, flight equipment, inflight and ancillary amenities, on-time
performance, flight completion ratios and baggage handling, will strengthen customer loyalty and attract new customers. Combined DOT
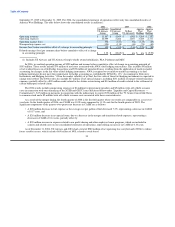
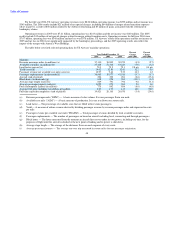
measures as reported by AWA and US Airways for the years ended December 31, 2006, 2005 and 2004 were as follows:
Full Year
2006 2005 2004
On-time performance(a) 76.9 77.8 78.1
Completion factor(b) 98.9 98.2 98.4
Mishandled baggage(c) 7.82 7.68 4.85
Customer complaints(d) 1.35 1.55 1.14
(a) Percentage of reported flight operations arriving on time as defined by the DOT.
(b) Percentage of scheduled flight operations completed.
(c) Rate of mishandled baggage reports per 1,000 passengers.
(d) Rate of customer complaints filed with the DOT per 100,000 passengers.
Our on-time performance for 2006 ranked second among the ten largest U.S. carriers as measured by the DOT. During 2006 we
achieved significant operational improvements at our Philadelphia hub. Specifically, customer complaints are down over 30 percent from
2005 levels. In addition, mishandled baggage per 1,000 enplanements is down nearly 15 percent year-over-year, with over 95 percent of
all local in-bound baggage now delivered to the baggage carousel in 19.1 minutes on average.
US Airways Group's Results of Operations
The full year 2006 includes the consolidated results of the new US Airways Group and its subsidiaries, including US Airways,
America West Holdings and AWA. As noted above, the 2005 statement of operations presented includes the consolidated results of
America West Holdings for the 269 days through September 27, 2005, the effective date of the merger, and the consolidated results of the
new US Airways Group for the 96 days from
38