US Airways 2006 Annual Report Download - page 173
Download and view the complete annual report
Please find page 173 of the 2006 US Airways annual report below. You can navigate through the pages in the report by either clicking on the pages listed below, or by using the keyword search tool below to find specific information within the annual report.-
 1
1 -
2
-
3
-
4
-
5
-
6
-
7
-
8
-
9
-
10
-
11
-
12
-
13
-
14
-
15
-
16
-
17
-
18
-
19
-
20
-
21
-
22
-
23
-
24
-
25
-
26
-
27
-
28
-
29
-
30
-
31
-
32
-
33
-
34
-
35
-
36
-
37
-
38
-
39
-
40
-
41
-
42
-
43
-
44
-
45
-
46
-
47
-
48
-
49
-
50
-
51
-
52
-
53
-
54
-
55
-
56
-
57
-
58
-
59
-
60
-
61
-
62
-
63
-
64
-
65
-
66
-
67
-
68
-
69
-
70
-
71
-
72
-
73
-
74
-
75
-
76
-
77
-
78
-
79
-
80
-
81
-
82
-
83
-
84
-
85
-
86
-
87
-
88
-
89
-
90
-
91
-
92
-
93
-
94
-
95
-
96
-
97
-
98
-
99
-
100
-
101
-
102
-
103
-
104
-
105
-
106
-
107
-
108
-
109
-
110
-
111
-
112
-
113
-
114
-
115
-
116
-
117
-
118
-
119
-
120
-
121
-
122
-
123
-
124
-
125
-
126
-
127
-
128
-
129
-
130
-
131
-
132
-
133
-
134
-
135
-
136
-
137
-
138
-
139
-
140
-
141
-
142
-
143
-
144
-
145
-
146
-
147
-
148
-
149
-
150
-
151
-
152
-
153
-
154
-
155
-
156
-
157
-
158
-
159
-
160
-
161
-
162
-
 163
163 -
 164
164 -
 165
165 -
 166
166 -
 167
167 -
 168
168 -
 169
169 -
 170
170 -
 171
171 -
 172
172 -
 173
173 -
 174
174 -
 175
175 -
 176
176 -
 177
177 -
 178
178 -
 179
179 -
 180
180 -
 181
181 -
 182
182 -
 183
183 -
184
-
185
-
186
-
187
-
188
-
189
-
190
-
191
-
192
-
193
-
194
-
195
-
196
-
197
-
198
-
199
-
200
-
201
-
202
-
203
-
204
-
205
-
206
-
207
-
208
-
209
-
210
-
211
-
212
-
213
-
214
-
215
-
216
-
217
-
218
-
219
-
220
-
221
-
222
-
223
-
224
-
225
-
226
-
227
-
228
-
229
-
230
-
231
-
232
-
233
-
234
-
235
-
236
-
237
-
238
-
239
-
240
-
241
-
242
-
243
-
244
-
245
-
246
-
247
-
248
-
249
-
250
-
251
-
252
-
253
-
254
-
255
-
256
-
257
-
258
-
259
-
260
-
261
-
262
-
263
-
264
-
265
-
266
-
267
-
268
-
269
-
270
-
271
-
272
-
273
-
274
-
275
-
276
-
277
-
278
-
279
-
280
-
281
 |
 |

Table of Contents
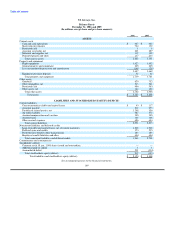
US Airways, Inc.
Statements of Cash Flows
(In millions)
Successor Company Predecessor Company
Three Months Nine Months
Year Ended Ended Ended Year Ended
December 31, December 31, September 30, December 31,
2006 2005 2005 2004
Cash flows from operating activities
Net income (loss) $ 345 $ (120) $ 280 $ (578)
Adjustments to reconcile net income (loss) to net cash provided by (used
in) operating activities
before reorganization items, net:
Fresh-start adjustments — — (697) 17
Depreciation and amortization 137 37 158 223
Gains on curtailments of postretirement benefits other than pensions — — (255) —
(Gains) losses on dispositions of property (2) 1 (2) —
Gain on forgiveness of debt (39) — — —
Amortization of deferred gains and credits (30) (14) (66) (79)
Amortization of debt discount 10 13 — —
Utilization of acquired net operations loss carryforwards 85 — — —
Stock-based compensation — — 10 50
Other (1) (7) (8) 3
Changes in operating assets and liabilities:
Decrease in restricted cash 6 79 12 52
Decrease (increase) in accounts receivables, net 26 65 (42) (5)
Decrease (increase) in materials and supplies, prepaid expenses, and
other assets 55 (1) (25) (42)
Increase (decrease) in air traffic liability (82) (77) 175 (15)
Increase (decrease) in accounts payable and accrued expenses (139) (15) 89 287
Increase (decrease) in postretirement benefits other than pensions,
employee benefit liabilities and other (6) (10) 8 44
Net cash provided by (used for) operating activities before
reorganization items 365 (49) (363) (43)
Reorganization items, net — (33) (92) (11)
Net cash provided by (used in) operating activities 365 (82) (455) (54)
Cash flows from investing activities
Purchases of property and equipment (146) (5) (136) (198)
Proceeds from sales of property and sale-leaseback transactions 5 539 211 18
Purchases of short-term investments (1,696) (132) — —
Sales of short-term investments 1,084 — — 358
Decrease (increase) in long-term restricted cash 109 46 (81) (128)
Net cash provided by (used in) investing activities (644) 448 (6) 50
Cash flows from financing activities
Proceeds from issuance of debt 92 — 140 240
Proceeds from issuance of debtor-in-possession financings — — 125 —
Increase in payables to affiliates, net 288 154 53 —
Repayments of debt and capital lease obligations (96) (434) (215) (425)
Net cash provided by (used in) financing activities 284 (280) 103 (185)
Net increase (decrease) in cash and cash equivalents 5 86 (358) (189)
Cash and cash equivalents at beginning of period 462 376 734 923
Cash and cash equivalents at end of period $ 467 $ 462 $ 376 $ 734
See accompanying notes to the financial statements.
170