US Airways 2006 Annual Report Download - page 42
Download and view the complete annual report
Please find page 42 of the 2006 US Airways annual report below. You can navigate through the pages in the report by either clicking on the pages listed below, or by using the keyword search tool below to find specific information within the annual report.-
 1
1 -
2
-
3
-
4
-
5
-
6
-
7
-
8
-
9
-
10
-
11
-
12
-
13
-
14
-
15
-
16
-
17
-
18
-
19
-
20
-
21
-
22
-
23
-
24
-
25
-
26
-
27
-
28
-
29
-
30
-
31
-
 32
32 -
 33
33 -
 34
34 -
 35
35 -
 36
36 -
 37
37 -
 38
38 -
 39
39 -
 40
40 -
 41
41 -
 42
42 -
 43
43 -
 44
44 -
 45
45 -
 46
46 -
 47
47 -
 48
48 -
 49
49 -
 50
50 -
 51
51 -
 52
52 -
53
-
54
-
55
-
56
-
57
-
58
-
59
-
60
-
61
-
62
-
63
-
64
-
65
-
66
-
67
-
68
-
69
-
70
-
71
-
72
-
73
-
74
-
75
-
76
-
77
-
78
-
79
-
80
-
81
-
82
-
83
-
84
-
85
-
86
-
87
-
88
-
89
-
90
-
91
-
92
-
93
-
94
-
95
-
96
-
97
-
98
-
99
-
100
-
101
-
102
-
103
-
104
-
105
-
106
-
107
-
108
-
109
-
110
-
111
-
112
-
113
-
114
-
115
-
116
-
117
-
118
-
119
-
120
-
121
-
122
-
123
-
124
-
125
-
126
-
127
-
128
-
129
-
130
-
131
-
132
-
133
-
134
-
135
-
136
-
137
-
138
-
139
-
140
-
141
-
142
-
143
-
144
-
145
-
146
-
147
-
148
-
149
-
150
-
151
-
152
-
153
-
154
-
155
-
156
-
157
-
158
-
159
-
160
-
161
-
162
-
163
-
164
-
165
-
166
-
167
-
168
-
169
-
170
-
171
-
172
-
173
-
174
-
175
-
176
-
177
-
178
-
179
-
180
-
181
-
182
-
183
-
184
-
185
-
186
-
187
-
188
-
189
-
190
-
191
-
192
-
193
-
194
-
195
-
196
-
197
-
198
-
199
-
200
-
201
-
202
-
203
-
204
-
205
-
206
-
207
-
208
-
209
-
210
-
211
-
212
-
213
-
214
-
215
-
216
-
217
-
218
-
219
-
220
-
221
-
222
-
223
-
224
-
225
-
226
-
227
-
228
-
229
-
230
-
231
-
232
-
233
-
234
-
235
-
236
-
237
-
238
-
239
-
240
-
241
-
242
-
243
-
244
-
245
-
246
-
247
-
248
-
249
-
250
-
251
-
252
-
253
-
254
-
255
-
256
-
257
-
258
-
259
-
260
-
261
-
262
-
263
-
264
-
265
-
266
-
267
-
268
-
269
-
270
-
271
-
272
-
273
-
274
-
275
-
276
-
277
-
278
-
279
-
280
-
281
 |
 |

Table of Contents
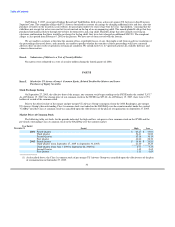
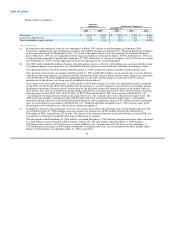
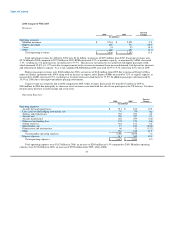
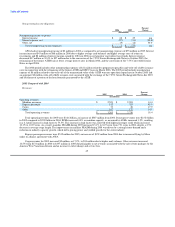
September 27, 2005 to December 31, 2005. For 2004, the consolidated statements of operations reflect only the consolidated results of
America West Holdings. The table below shows the consolidated results (in millions):
2006 2005 2004
Consolidated Consolidated America America
US Airways US Airways 96 Days West West
Group Group US Airways(1) Holdings Holdings
Operating revenues $ 11,557 $ 5,069 $ 1,805 $ 3,264 $ 2,757
Operating expenses 10,999 5,286 1,897 3,389 2,777
Operating income (loss) 558 (217) (92) (125) (20)
Nonoperating expense, net (154) (118) (44) (74) (69)
Income (loss) before cumulative effect of a change in accounting principle $ 303 $ (335) $ (136) $ (199) $ (89)
Diluted earnings (loss) per common share before cumulative effect of a change
in accounting principle $ 3.32 $ (10.65) $ n/a $ n/a $ (5.99)
(1) Includes US Airways and US Airways Group's wholly owned subsidiaries, PSA, Piedmont and MSC.
In 2006, we realized operating income of $558 million and income before cumulative effect of change in accounting principle of
$303 million. These results include $79 million of net losses associated with AWA's fuel hedging transactions. This includes $9 million
of net realized losses on settled hedge transactions and $70 million of unrealized losses resulting from the application of mark-to-market
accounting for changes in the fair value of fuel hedging instruments. AWA is required to use mark-to-market accounting as its fuel
hedging instruments do not meet the requirements for hedge accounting as established by SFAS No. 133, "Accounting for Derivative
Instruments and Hedging Activities." Given the market volatility of jet fuel, the fair value of these fuel hedging instruments is expected to
change until settled. The 2006 results also include $27 million of net special charges, including $131 million of merger-related transition
expenses, partially offset by a $90 million credit related to the Airbus restructuring and $14 million of credits related to the settlement of
certain bankruptcy-related claims.
The 2006 results include nonoperating expenses of $6 million for prepayment penalties and $5 million write-off of debt issuance
costs in connection with our refinancing of the ATSB and GECC loans (discussed below under "Liquidity and Capital Resources —
Commitments"), $17 million in payments in connection with the inducement to convert $70 million of the 7% Senior Convertible Notes
to common stock and a $2 million write off of debt issuance costs associated with those converted notes.
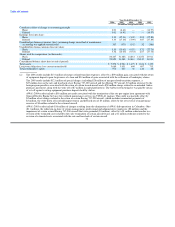
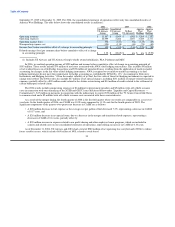
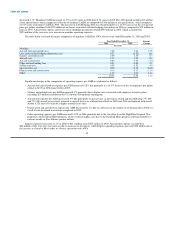
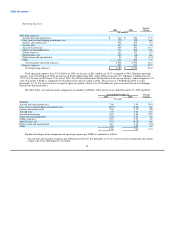
As a result of the merger timing, the fourth quarter of 2006 is the first full quarter where our results are comparable on a year-over-
year basis. In the fourth quarter of 2006, our CASM was 10.98 cents compared to 11.12 cents for the fourth quarter of 2005. The
significant components of the quarter-over-quarter net decrease in CASM are as follows:
• A $28 million decrease in fuel expense as the average cost per gallon of fuel decreased 7.2%, representing a decrease in CASM
of 0.17 cents, and
• A $26 million decrease in net special items, due to a decrease in the merger and transition related expenses, representing a
decrease in CASM of 0.14 cents, partially offset by
• A $20 million increase in expense related to our profit sharing and other employee bonus programs, which are included in
salaries and related costs on our consolidated statements of operations, representing an increase in CASM of 0.10 cents.
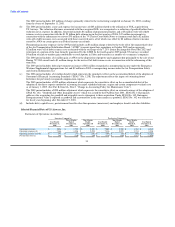
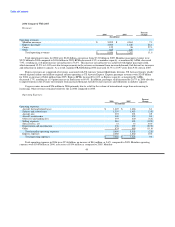
As of December 31, 2006, US Airways and AWA had a total of $980 million of net operating loss carryforwards (NOL) to reduce
future taxable income, which includes $69 million of NOL related to stock-based
39