US Airways 2006 Annual Report Download - page 35
Download and view the complete annual report
Please find page 35 of the 2006 US Airways annual report below. You can navigate through the pages in the report by either clicking on the pages listed below, or by using the keyword search tool below to find specific information within the annual report.-
 1
1 -
2
-
3
-
4
-
5
-
6
-
7
-
8
-
9
-
10
-
11
-
12
-
13
-
14
-
15
-
16
-
17
-
18
-
19
-
20
-
21
-
22
-
23
-
24
-
 25
25 -
 26
26 -
 27
27 -
 28
28 -
 29
29 -
 30
30 -
 31
31 -
 32
32 -
 33
33 -
 34
34 -
 35
35 -
 36
36 -
 37
37 -
 38
38 -
 39
39 -
 40
40 -
 41
41 -
 42
42 -
 43
43 -
 44
44 -
 45
45 -
46
-
47
-
48
-
49
-
50
-
51
-
52
-
53
-
54
-
55
-
56
-
57
-
58
-
59
-
60
-
61
-
62
-
63
-
64
-
65
-
66
-
67
-
68
-
69
-
70
-
71
-
72
-
73
-
74
-
75
-
76
-
77
-
78
-
79
-
80
-
81
-
82
-
83
-
84
-
85
-
86
-
87
-
88
-
89
-
90
-
91
-
92
-
93
-
94
-
95
-
96
-
97
-
98
-
99
-
100
-
101
-
102
-
103
-
104
-
105
-
106
-
107
-
108
-
109
-
110
-
111
-
112
-
113
-
114
-
115
-
116
-
117
-
118
-
119
-
120
-
121
-
122
-
123
-
124
-
125
-
126
-
127
-
128
-
129
-
130
-
131
-
132
-
133
-
134
-
135
-
136
-
137
-
138
-
139
-
140
-
141
-
142
-
143
-
144
-
145
-
146
-
147
-
148
-
149
-
150
-
151
-
152
-
153
-
154
-
155
-
156
-
157
-
158
-
159
-
160
-
161
-
162
-
163
-
164
-
165
-
166
-
167
-
168
-
169
-
170
-
171
-
172
-
173
-
174
-
175
-
176
-
177
-
178
-
179
-
180
-
181
-
182
-
183
-
184
-
185
-
186
-
187
-
188
-
189
-
190
-
191
-
192
-
193
-
194
-
195
-
196
-
197
-
198
-
199
-
200
-
201
-
202
-
203
-
204
-
205
-
206
-
207
-
208
-
209
-
210
-
211
-
212
-
213
-
214
-
215
-
216
-
217
-
218
-
219
-
220
-
221
-
222
-
223
-
224
-
225
-
226
-
227
-
228
-
229
-
230
-
231
-
232
-
233
-
234
-
235
-
236
-
237
-
238
-
239
-
240
-
241
-
242
-
243
-
244
-
245
-
246
-
247
-
248
-
249
-
250
-
251
-
252
-
253
-
254
-
255
-
256
-
257
-
258
-
259
-
260
-
261
-
262
-
263
-
264
-
265
-
266
-
267
-
268
-
269
-
270
-
271
-
272
-
273
-
274
-
275
-
276
-
277
-
278
-
279
-
280
-
281
 |
 |

Table of Contents
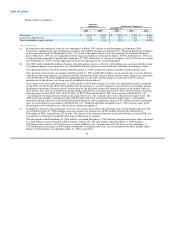
Year Ended December 31,
2006 2005 2004 2003 2002
(In millions except share data)
Cumulative effect of change in accounting principle
Basic 0.01 (6.41) — — (14.97)
Diluted 0.01 (6.41) — — (14.97)
Earnings (loss) per share:
Basic 3.51 (17.06) (5.99) 4.03 (27.89)
Diluted 3.33 (17.06) (5.99) 3.07 (27.89)
Unaudited pro forma net income (loss) (assuming change in method of maintenance
accounting was applied retroactively) 303 (335) (142) 52 (386)
Unaudited pro forma earnings (loss) per share
Basic 3.50 (10.65) (9.53) 3.71 (27.76)
Diluted 3.32 (10.65) (9.53) 2.87 (27.76)
Shares used for computation (in thousands):
Basic 86,447 31,488 14,861 14,252 13,911
Diluted 93,821 31,488 14,861 23,147 13,911
Consolidated balance sheet data (at end of period):
Total assets $ 7,576 $ 6,964 $ 1,475 $ 1,614 $ 1,439
Long-term obligations, less current maturities(d) 3,689 3,631 640 697 713
Total stockholders' equity 970 420 36 126 68
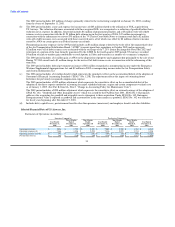
(a) The 2006 results include $131 million of merger related transition expenses, offset by a $90 million gain associated with the return
of equipment deposits upon forgiveness of a loan and $14 million of gains associated with the settlement of bankruptcy claims.
The 2005 results include $121 million of special charges, including $28 million of merger related transition expenses, a
$27 million loss on the sale and leaseback of six Boeing 737-300 aircraft and two Boeing 757 aircraft, $7 million of power by the
hour program penalties associated with the return of certain leased aircraft and a $50 million charge related to an amended Airbus
purchase agreement, along with the write off of $7 million in capitalized interest. The Airbus restructuring fee was paid by means
of set-off against existing equipment purchase deposits held by Airbus.
AWA's 2004 results include a $16 million net credit associated with the termination of the rate per engine hour agreement with
General Electric Engine Services for overhaul maintenance services on V2500-A1 engines. This credit was partially offset by
$2 million of net charges related to the return of certain Boeing 737-200 aircraft, which includes termination payments of
$2 million, the write-down of leasehold improvements and deferred rent of $3 million, offset by the net reversal of maintenance
reserves of $3 million related to the returned aircraft.
AWA's 2003 results include $16 million of charges resulting from the elimination of AWA's hub operations in Columbus, Ohio
($11 million), the reduction-in-force of certain management, professional and administrative employees ($2 million) and the
impairment of certain owned Boeing 737-200 aircraft that were grounded ($3 million), offset by a $1 million reduction due to a
revision of the estimated costs related to the early termination of certain aircraft leases and a $1 million reduction related to the
revision of estimated costs associated with the sale and leaseback of certain aircraft.
32