US Airways 2006 Annual Report Download - page 56
Download and view the complete annual report
Please find page 56 of the 2006 US Airways annual report below. You can navigate through the pages in the report by either clicking on the pages listed below, or by using the keyword search tool below to find specific information within the annual report.-
 1
1 -
2
-
3
-
4
-
5
-
6
-
7
-
8
-
9
-
10
-
11
-
12
-
13
-
14
-
15
-
16
-
17
-
18
-
19
-
20
-
21
-
22
-
23
-
24
-
25
-
26
-
27
-
28
-
29
-
30
-
31
-
32
-
33
-
34
-
35
-
36
-
37
-
38
-
39
-
40
-
41
-
42
-
43
-
44
-
45
-
 46
46 -
 47
47 -
 48
48 -
 49
49 -
 50
50 -
 51
51 -
 52
52 -
 53
53 -
 54
54 -
 55
55 -
 56
56 -
 57
57 -
 58
58 -
 59
59 -
 60
60 -
 61
61 -
 62
62 -
 63
63 -
 64
64 -
 65
65 -
 66
66 -
67
-
68
-
69
-
70
-
71
-
72
-
73
-
74
-
75
-
76
-
77
-
78
-
79
-
80
-
81
-
82
-
83
-
84
-
85
-
86
-
87
-
88
-
89
-
90
-
91
-
92
-
93
-
94
-
95
-
96
-
97
-
98
-
99
-
100
-
101
-
102
-
103
-
104
-
105
-
106
-
107
-
108
-
109
-
110
-
111
-
112
-
113
-
114
-
115
-
116
-
117
-
118
-
119
-
120
-
121
-
122
-
123
-
124
-
125
-
126
-
127
-
128
-
129
-
130
-
131
-
132
-
133
-
134
-
135
-
136
-
137
-
138
-
139
-
140
-
141
-
142
-
143
-
144
-
145
-
146
-
147
-
148
-
149
-
150
-
151
-
152
-
153
-
154
-
155
-
156
-
157
-
158
-
159
-
160
-
161
-
162
-
163
-
164
-
165
-
166
-
167
-
168
-
169
-
170
-
171
-
172
-
173
-
174
-
175
-
176
-
177
-
178
-
179
-
180
-
181
-
182
-
183
-
184
-
185
-
186
-
187
-
188
-
189
-
190
-
191
-
192
-
193
-
194
-
195
-
196
-
197
-
198
-
199
-
200
-
201
-
202
-
203
-
204
-
205
-
206
-
207
-
208
-
209
-
210
-
211
-
212
-
213
-
214
-
215
-
216
-
217
-
218
-
219
-
220
-
221
-
222
-
223
-
224
-
225
-
226
-
227
-
228
-
229
-
230
-
231
-
232
-
233
-
234
-
235
-
236
-
237
-
238
-
239
-
240
-
241
-
242
-
243
-
244
-
245
-
246
-
247
-
248
-
249
-
250
-
251
-
252
-
253
-
254
-
255
-
256
-
257
-
258
-
259
-
260
-
261
-
262
-
263
-
264
-
265
-
266
-
267
-
268
-
269
-
270
-
271
-
272
-
273
-
274
-
275
-
276
-
277
-
278
-
279
-
280
-
281
 |
 |

Table of Contents
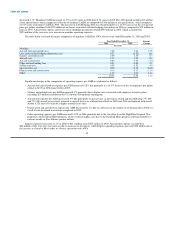
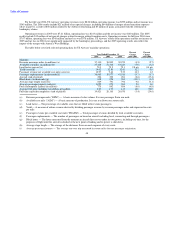
• Salaries and related costs per ASM decreased 33.5% primarily due to lower wage and benefits rates as a result of the cost-savings
agreements achieved with each of the collective bargaining groups, including the termination of defined benefit pension plans
and the curtailment of postretirement benefits, as well as lower headcount as compared to the same period in 2004.
• Aircraft maintenance per ASM increased 15.8% reflecting the shift to outside vendors to perform scheduled maintenance,
partially offsetting the decrease in salaries and related costs described above.
• Selling expenses per ASM decreased 7.4% primarily due to reduction in travel agent commissions, the termination of certain
marketing contracts and reductions in advertising programs as a result of the bankruptcy.
• Depreciation and amortization per ASM decreased 9.8% as a result of fewer owned aircraft in the operating fleet and lower book
values on the continuing fleet as a result of fresh-start reporting.
• Other operating expenses per ASM increased 7.9% primarily as a result of increases associated with the redemption of Dividend
Miles on partner airlines and future travel on US Airways as well as with outsourced aircraft cleaning services. These increases
were partially offset by decreases in insurance expense, outsourced technology services and schedule-related costs including
passenger food expenses.
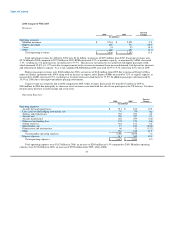
Express expenses increased 18.5% to $1.86 billion in 2005 as compared to 2004, reflecting a 14.8% increase in purchased ASMs,
increased flying by the former MidAtlantic division in 2005 and higher fuel prices that were paid by US Airways for US Airways Express
operations.
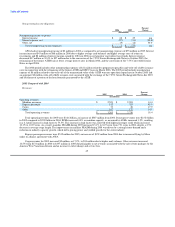
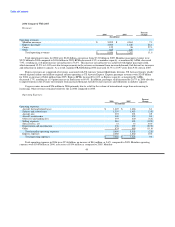
Nonoperating Income (Expense):
Percent
2005 2004 Change
(In millions)
Nonoperating income (expense)
Interest income $ 26 $ 12 nm
Interest expense, net (287) (236) 21.6
Reorganization items, net 636 (32) nm
Other, net (4) 19 nm
Total nonoperating income (expense) $ 371 $ (237) nm
US Airways had net nonoperating income of $371 million in 2005 compared to nonoperating expense of $237 million in 2004. The
change in nonoperating income (expense) is primarily a result of $636 million of net reorganization items representing amounts incurred
as a direct result of the Chapter 11 proceedings. See the description below for additional information on the components of reorganization
items. Interest income increased $14 million in 2005 as compared to 2004 due to higher cash balances, principally in the fourth quarter of
2005, and higher average interest rates on cash, cash equivalents and short-term investments. Interest expense increased $51 million as a
result of increased interest expense on the loan formerly guaranteed by the ATSB, including penalty interest incurred as a result of the
bankruptcy proceedings and interest associated with the purchase of new regional jets. The 2005 period included nonoperating expenses
of $4 million, which include foreign exchange losses and unfavorable mark-to-market adjustments on certain stock options held by
US Airways. The 2004 period includes $13 million related to a business interruption insurance recovery and a $2 million gain on the sale
of four aircraft.
53