US Airways 2006 Annual Report Download - page 46
Download and view the complete annual report
Please find page 46 of the 2006 US Airways annual report below. You can navigate through the pages in the report by either clicking on the pages listed below, or by using the keyword search tool below to find specific information within the annual report.-
 1
1 -
2
-
3
-
4
-
5
-
6
-
7
-
8
-
9
-
10
-
11
-
12
-
13
-
14
-
15
-
16
-
17
-
18
-
19
-
20
-
21
-
22
-
23
-
24
-
25
-
26
-
27
-
28
-
29
-
30
-
31
-
32
-
33
-
34
-
35
-
 36
36 -
 37
37 -
 38
38 -
 39
39 -
 40
40 -
 41
41 -
 42
42 -
 43
43 -
 44
44 -
 45
45 -
 46
46 -
 47
47 -
 48
48 -
 49
49 -
 50
50 -
 51
51 -
 52
52 -
 53
53 -
 54
54 -
 55
55 -
 56
56 -
57
-
58
-
59
-
60
-
61
-
62
-
63
-
64
-
65
-
66
-
67
-
68
-
69
-
70
-
71
-
72
-
73
-
74
-
75
-
76
-
77
-
78
-
79
-
80
-
81
-
82
-
83
-
84
-
85
-
86
-
87
-
88
-
89
-
90
-
91
-
92
-
93
-
94
-
95
-
96
-
97
-
98
-
99
-
100
-
101
-
102
-
103
-
104
-
105
-
106
-
107
-
108
-
109
-
110
-
111
-
112
-
113
-
114
-
115
-
116
-
117
-
118
-
119
-
120
-
121
-
122
-
123
-
124
-
125
-
126
-
127
-
128
-
129
-
130
-
131
-
132
-
133
-
134
-
135
-
136
-
137
-
138
-
139
-
140
-
141
-
142
-
143
-
144
-
145
-
146
-
147
-
148
-
149
-
150
-
151
-
152
-
153
-
154
-
155
-
156
-
157
-
158
-
159
-
160
-
161
-
162
-
163
-
164
-
165
-
166
-
167
-
168
-
169
-
170
-
171
-
172
-
173
-
174
-
175
-
176
-
177
-
178
-
179
-
180
-
181
-
182
-
183
-
184
-
185
-
186
-
187
-
188
-
189
-
190
-
191
-
192
-
193
-
194
-
195
-
196
-
197
-
198
-
199
-
200
-
201
-
202
-
203
-
204
-
205
-
206
-
207
-
208
-
209
-
210
-
211
-
212
-
213
-
214
-
215
-
216
-
217
-
218
-
219
-
220
-
221
-
222
-
223
-
224
-
225
-
226
-
227
-
228
-
229
-
230
-
231
-
232
-
233
-
234
-
235
-
236
-
237
-
238
-
239
-
240
-
241
-
242
-
243
-
244
-
245
-
246
-
247
-
248
-
249
-
250
-
251
-
252
-
253
-
254
-
255
-
256
-
257
-
258
-
259
-
260
-
261
-
262
-
263
-
264
-
265
-
266
-
267
-
268
-
269
-
270
-
271
-
272
-
273
-
274
-
275
-
276
-
277
-
278
-
279
-
280
-
281
 |
 |

Table of Contents
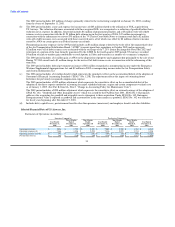
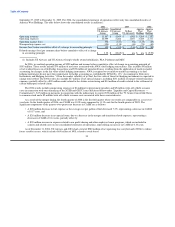
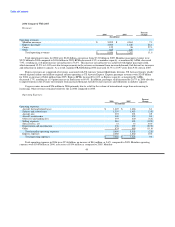
2006 Compared With 2005
Revenues:
Percent
2006 2005 Change
(In millions)
Operating revenues:
Mainline passenger $ 2,761 $ 2,521 9.5
Express passenger 660 512 28.9
Cargo 31 33 (6.1)
Other 184 197 (6.6)
Total operating revenues $ 3,636 $ 3,263 11.4
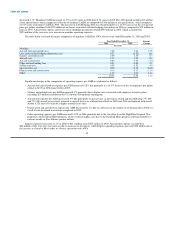
Total operating revenues for AWA for 2006 were $3.64 billion, an increase of $373 million from 2005. Passenger revenues were
$2.76 billion in 2006 compared to $2.52 billion in 2005. RPMs decreased 2.9% as mainline capacity, as measured by ASMs, decreased
3.1%, resulting in a 0.2 point increase in load factor to 79.7%. This increase in load factor was achieved with higher passenger yield,
which increased 12.8% to 11.72 cents due to improvements in the revenue environment from increased demand, fuel driven fare increases
and reductions in industry capacity. As a result, mainline PRASM during 2006 increased 12.9% to 9.34 cents from 8.27 cents in 2005.
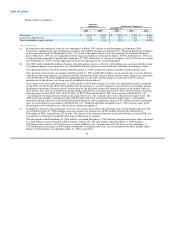
Express passenger revenues were $660 million for 2006, an increase of $148 million from 2005 due to increased flying by Mesa
under its alliance agreement with AWA along with an increase in express yield. Express RPMs increased by 7.8% as express capacity, as
measured by ASM's, increased 2.7%, resulting in a 3.6 point increase in load factor to 75.5%. In addition passenger yield increased by
19.5% in 2006 due to the improved industry pricing environment.
Cargo revenue was relatively flat in 2006 compared to 2005. Other revenues decreased 6.6% from $197 million in 2005 to
$184 million in 2006 due principally to a decrease in net revenues associated with the sale of tour packages by the US Airways Vacations
division and a decrease in ticket change and service fees.
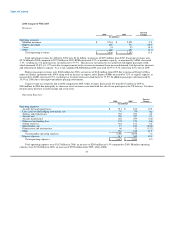
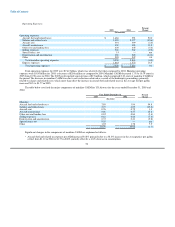
Operating Expenses:
Percent
2006 2005 Change
(In millions)
Operating expenses:
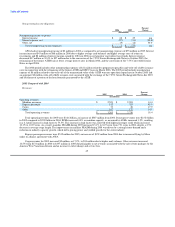
Aircraft fuel and related taxes $ 911 $ 812 12.2
Loss (gain) on fuel hedging instruments, net 79 (75) nm
Salaries and related costs 735 701 4.9
Aircraft rent 339 327 3.7
Aircraft maintenance 242 259 (6.6)
Other rent and landing fees 175 176 (0.6)
Selling expenses 162 161 0.6
Special items, net 17 106 (84.0)
Depreciation and amortization 46 53 (13.2)
Other 354 318 11.3
Total mainline operating expenses 3,060 2,838 7.8
Express expenses 611 545 12.1
Total operating expenses $ 3,671 $ 3,383 8.5
Total operating expenses were $3.67 billion in 2006, an increase of $288 million or 8.5% compared to 2005. Mainline operating
expenses were $3.06 billion in 2006, an increase of $222 million from 2005, while ASMs
43