US Airways 2006 Annual Report Download - page 218
Download and view the complete annual report
Please find page 218 of the 2006 US Airways annual report below. You can navigate through the pages in the report by either clicking on the pages listed below, or by using the keyword search tool below to find specific information within the annual report.-
 1
1 -
2
-
3
-
4
-
5
-
6
-
7
-
8
-
9
-
10
-
11
-
12
-
13
-
14
-
15
-
16
-
17
-
18
-
19
-
20
-
21
-
22
-
23
-
24
-
25
-
26
-
27
-
28
-
29
-
30
-
31
-
32
-
33
-
34
-
35
-
36
-
37
-
38
-
39
-
40
-
41
-
42
-
43
-
44
-
45
-
46
-
47
-
48
-
49
-
50
-
51
-
52
-
53
-
54
-
55
-
56
-
57
-
58
-
59
-
60
-
61
-
62
-
63
-
64
-
65
-
66
-
67
-
68
-
69
-
70
-
71
-
72
-
73
-
74
-
75
-
76
-
77
-
78
-
79
-
80
-
81
-
82
-
83
-
84
-
85
-
86
-
87
-
88
-
89
-
90
-
91
-
92
-
93
-
94
-
95
-
96
-
97
-
98
-
99
-
100
-
101
-
102
-
103
-
104
-
105
-
106
-
107
-
108
-
109
-
110
-
111
-
112
-
113
-
114
-
115
-
116
-
117
-
118
-
119
-
120
-
121
-
122
-
123
-
124
-
125
-
126
-
127
-
128
-
129
-
130
-
131
-
132
-
133
-
134
-
135
-
136
-
137
-
138
-
139
-
140
-
141
-
142
-
143
-
144
-
145
-
146
-
147
-
148
-
149
-
150
-
151
-
152
-
153
-
154
-
155
-
156
-
157
-
158
-
159
-
160
-
161
-
162
-
163
-
164
-
165
-
166
-
167
-
168
-
169
-
170
-
171
-
172
-
173
-
174
-
175
-
176
-
177
-
178
-
179
-
180
-
181
-
182
-
183
-
184
-
185
-
186
-
187
-
188
-
189
-
190
-
191
-
192
-
193
-
194
-
195
-
196
-
197
-
198
-
199
-
200
-
201
-
202
-
203
-
204
-
205
-
206
-
207
-
 208
208 -
 209
209 -
 210
210 -
 211
211 -
 212
212 -
 213
213 -
 214
214 -
 215
215 -
 216
216 -
 217
217 -
 218
218 -
 219
219 -
 220
220 -
 221
221 -
 222
222 -
 223
223 -
 224
224 -
 225
225 -
 226
226 -
 227
227 -
 228
228 -
229
-
230
-
231
-
232
-
233
-
234
-
235
-
236
-
237
-
238
-
239
-
240
-
241
-
242
-
243
-
244
-
245
-
246
-
247
-
248
-
249
-
250
-
251
-
252
-
253
-
254
-
255
-
256
-
257
-
258
-
259
-
260
-
261
-
262
-
263
-
264
-
265
-
266
-
267
-
268
-
269
-
270
-
271
-
272
-
273
-
274
-
275
-
276
-
277
-
278
-
279
-
280
-
281
 |
 |

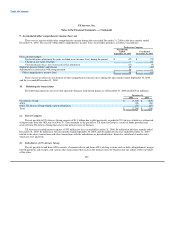
Table of Contents
US Airways, Inc.
Notes to the Financial Statements — (Continued)
Weighted
Average
Stock Weighted Remaining Aggregate
Options Average Contractual Term Intrinsic Value
and SARs Exercise Price (Years) (In millions)
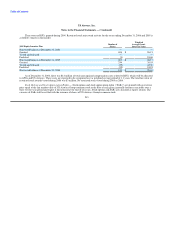
Balance at December 31, 2006 798 $ 18.33 6.96 $ 28
Vested or expected to vest at December 31, 2006 776 $ 18.25 6.73 $ 28
Exercisable at December 31, 2006 592 $ 17.40 6.39 $ 22
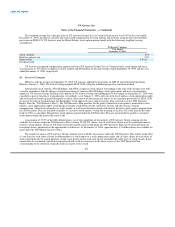
2005 Equity Incentive Plan
Balance at December 31, 2004 — —
Granted 2,034 $ 23.08
Exercised — —
Forfeited (61) 20.64
Expired — —
Balance at December 31, 2005 1,973 $ 23.15
Granted 1,310 40.30
Exercised (701) 24.49
Forfeited (87) 30.34
Expired — —
Balance at December 31, 2006 2,495 $ 31.53 9.09 $ 56
Vested or expected to vest at December 31, 2006 2,254 $ 31.53 9.05 $ 50
Exercisable at December 31, 2006 164 $ 32.79 8.99 $ 3
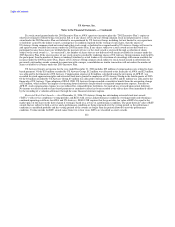
The fair value of stock options and SARs is determined at the grant date using a Black-Scholes option pricing model, which requires
several assumptions. The risk-free interest rate is based on the U.S. Treasury yield curve in effect for the expected term of the stock
option or SAR at the time of grant. The dividend yield is assumed to be zero since US Airways Group does not pay dividends and has no
current plans to do so in the future. The volatility is based on the historical volatility of US Airways Group common stock over a time
period equal to the expected term of the stock option or SAR. The expected life of stock options and SARs is based on the historical
experience of US Airways Group.
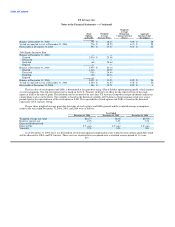
The per share weighted-average grant-date fair value of stock options and SARs granted and the weighted-average assumptions
used for the year ended December 31, 2006, 2005, and 2004 were as follows:
Year Ended
December 31, 2006 December 31, 2005 December 31, 2004
Weighted average fair value $16.77 $8.50 $10.90
Risk free interest rate 4.8% 3.4% 3.4%
Expected dividend yield — — —
Expected life 2.9 years 4.0 years 4.8 years
Volatility 57% 54% 54%
As of December 31, 2006, there was $24 million of total unrecognized compensation costs related to stock options and SARs which
will be allocated to AWA and US Airways. These costs are expected to be recognized over a weighted average period of 1.4 years.
215