US Airways 2006 Annual Report Download - page 90
Download and view the complete annual report
Please find page 90 of the 2006 US Airways annual report below. You can navigate through the pages in the report by either clicking on the pages listed below, or by using the keyword search tool below to find specific information within the annual report.-
 1
1 -
2
-
3
-
4
-
5
-
6
-
7
-
8
-
9
-
10
-
11
-
12
-
13
-
14
-
15
-
16
-
17
-
18
-
19
-
20
-
21
-
22
-
23
-
24
-
25
-
26
-
27
-
28
-
29
-
30
-
31
-
32
-
33
-
34
-
35
-
36
-
37
-
38
-
39
-
40
-
41
-
42
-
43
-
44
-
45
-
46
-
47
-
48
-
49
-
50
-
51
-
52
-
53
-
54
-
55
-
56
-
57
-
58
-
59
-
60
-
61
-
62
-
63
-
64
-
65
-
66
-
67
-
68
-
69
-
70
-
71
-
72
-
73
-
74
-
75
-
76
-
77
-
78
-
79
-
 80
80 -
 81
81 -
 82
82 -
 83
83 -
 84
84 -
 85
85 -
 86
86 -
 87
87 -
 88
88 -
 89
89 -
 90
90 -
 91
91 -
 92
92 -
 93
93 -
 94
94 -
 95
95 -
 96
96 -
 97
97 -
 98
98 -
 99
99 -
 100
100 -
101
-
102
-
103
-
104
-
105
-
106
-
107
-
108
-
109
-
110
-
111
-
112
-
113
-
114
-
115
-
116
-
117
-
118
-
119
-
120
-
121
-
122
-
123
-
124
-
125
-
126
-
127
-
128
-
129
-
130
-
131
-
132
-
133
-
134
-
135
-
136
-
137
-
138
-
139
-
140
-
141
-
142
-
143
-
144
-
145
-
146
-
147
-
148
-
149
-
150
-
151
-
152
-
153
-
154
-
155
-
156
-
157
-
158
-
159
-
160
-
161
-
162
-
163
-
164
-
165
-
166
-
167
-
168
-
169
-
170
-
171
-
172
-
173
-
174
-
175
-
176
-
177
-
178
-
179
-
180
-
181
-
182
-
183
-
184
-
185
-
186
-
187
-
188
-
189
-
190
-
191
-
192
-
193
-
194
-
195
-
196
-
197
-
198
-
199
-
200
-
201
-
202
-
203
-
204
-
205
-
206
-
207
-
208
-
209
-
210
-
211
-
212
-
213
-
214
-
215
-
216
-
217
-
218
-
219
-
220
-
221
-
222
-
223
-
224
-
225
-
226
-
227
-
228
-
229
-
230
-
231
-
232
-
233
-
234
-
235
-
236
-
237
-
238
-
239
-
240
-
241
-
242
-
243
-
244
-
245
-
246
-
247
-
248
-
249
-
250
-
251
-
252
-
253
-
254
-
255
-
256
-
257
-
258
-
259
-
260
-
261
-
262
-
263
-
264
-
265
-
266
-
267
-
268
-
269
-
270
-
271
-
272
-
273
-
274
-
275
-
276
-
277
-
278
-
279
-
280
-
281
 |
 |

Table of Contents
US Airways Group, Inc.
Notes to Consolidated Financial Statements — (Continued)
program, which is substantially the same as the former US Airways program. As part of the merger of the plans, the accounts of members
participating in both programs were merged into single accounts of the new program. Members of the new Dividend Miles program can
redeem miles on either AWA, US Airways, or other members of the Star Alliance. During the second quarter of 2006, the Company
recorded $11 million of expense in special items, net — merger-related transition expenses to increase its estimated cost of providing free
travel based on the terms of the new Dividend Miles program, due primarily to members of the former FlightFund program gaining
access to international routes operated by US Airways and Star Alliance members, which carry higher costs.
The estimated cost of providing the free travel, using the incremental cost method as adjusted for estimated redemption rates, is
recognized as a liability and charged to operations as program members accumulate mileage and requisite mileage award levels are
achieved. For travel awards on partner airlines, the liability is based on the average contractual amount to be paid to the other airline per
redemption. As of December 31, 2006, Dividend Miles members had accumulated mileage credits for approximately 3.8 million awards.
The liability for the future travel awards accrued on the Company's balance sheets within other accrued liabilities was $201 million and
$157 million as of December 31, 2006 and 2005, respectively.
The Company sells mileage credits to participating airline and non-airline business partners. Revenue earned from selling mileage
credits to other companies is recognized in two components. A portion of the revenue from these sales is deferred, representing the
estimated fair value of the transportation component of the sold mileage credits. The deferred revenue for the transportation component is
amortized on a straight-line basis over the period in which the credits are expected to be redeemed for travel as passenger revenue, which
is currently estimated to be 28 months. The marketing component, which is earned at the time the miles are sold, is recognized in other
revenues at the time of the sale. As of December 31, 2006 and 2005, the Company had $220 million and $214 million, respectively, in
deferred revenue from the sale of mileage credits included in other accrued liabilities on its balance sheets.
(k) Derivative Instruments
The Company utilizes financial derivative instruments primarily to manage its risk associated with changing jet fuel prices. The
Company currently utilizes heating oil-based derivative instruments to hedge a portion of its exposure to jet fuel price increases. These
instruments consist of costless collars which hedge approximately 29% of its 2007 total anticipated jet fuel requirements as of
December 31, 2006. The Company does not purchase or hold any derivative financial instruments for trading purposes.
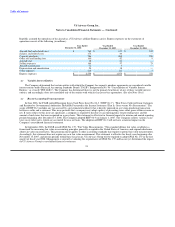
The weighted average collar range of the fuel hedges outstanding as of December 31, 2006 are as follows:
Put Option Call Option
Heating oil ($/gallon) $ 1.86 $ 2.06
Estimated Crude Oil Equivalent ($/barrel) $ 68.78 $ 77.18
SFAS No. 133, "Accounting for Derivative Instruments and Hedging Activities, as amended," ("SFAS 133") requires that all
derivatives be marked to market (fair value) and recorded on the balance sheet. Derivatives that are not hedges must be adjusted to fair
value through income.
As of December 31, 2006 and 2005, US Airways had no open fuel hedge positions in place. As of December 31, 2006 and 2005,
AWA had open fuel hedge positions in place, which do not currently qualify for hedge accounting under SFAS 133. Accordingly, the
derivative hedging instruments are recorded as an asset or liability on the balance sheets at fair value and any changes in fair value are
recorded as gains on fuel hedging instruments, net in operating expenses in the accompanying consolidated statements of operations in
the period of change. During 2006, 2005 and 2004, AWA recognized a net loss of $79 million, a net gain of $75 million and a net gain of
$24 million, respectively, related to hedging activities. The fair value of AWA's financial derivative instruments at December 31, 2006
and 2005 was a net liability of approximately $66 million and a net asset of $4 million, respectively. Since
87