US Airways 2006 Annual Report Download - page 102
Download and view the complete annual report
Please find page 102 of the 2006 US Airways annual report below. You can navigate through the pages in the report by either clicking on the pages listed below, or by using the keyword search tool below to find specific information within the annual report.-
 1
1 -
2
-
3
-
4
-
5
-
6
-
7
-
8
-
9
-
10
-
11
-
12
-
13
-
14
-
15
-
16
-
17
-
18
-
19
-
20
-
21
-
22
-
23
-
24
-
25
-
26
-
27
-
28
-
29
-
30
-
31
-
32
-
33
-
34
-
35
-
36
-
37
-
38
-
39
-
40
-
41
-
42
-
43
-
44
-
45
-
46
-
47
-
48
-
49
-
50
-
51
-
52
-
53
-
54
-
55
-
56
-
57
-
58
-
59
-
60
-
61
-
62
-
63
-
64
-
65
-
66
-
67
-
68
-
69
-
70
-
71
-
72
-
73
-
74
-
75
-
76
-
77
-
78
-
79
-
80
-
81
-
82
-
83
-
84
-
85
-
86
-
87
-
88
-
89
-
90
-
91
-
 92
92 -
 93
93 -
 94
94 -
 95
95 -
 96
96 -
 97
97 -
 98
98 -
 99
99 -
 100
100 -
 101
101 -
 102
102 -
 103
103 -
 104
104 -
 105
105 -
 106
106 -
 107
107 -
 108
108 -
 109
109 -
 110
110 -
 111
111 -
 112
112 -
113
-
114
-
115
-
116
-
117
-
118
-
119
-
120
-
121
-
122
-
123
-
124
-
125
-
126
-
127
-
128
-
129
-
130
-
131
-
132
-
133
-
134
-
135
-
136
-
137
-
138
-
139
-
140
-
141
-
142
-
143
-
144
-
145
-
146
-
147
-
148
-
149
-
150
-
151
-
152
-
153
-
154
-
155
-
156
-
157
-
158
-
159
-
160
-
161
-
162
-
163
-
164
-
165
-
166
-
167
-
168
-
169
-
170
-
171
-
172
-
173
-
174
-
175
-
176
-
177
-
178
-
179
-
180
-
181
-
182
-
183
-
184
-
185
-
186
-
187
-
188
-
189
-
190
-
191
-
192
-
193
-
194
-
195
-
196
-
197
-
198
-
199
-
200
-
201
-
202
-
203
-
204
-
205
-
206
-
207
-
208
-
209
-
210
-
211
-
212
-
213
-
214
-
215
-
216
-
217
-
218
-
219
-
220
-
221
-
222
-
223
-
224
-
225
-
226
-
227
-
228
-
229
-
230
-
231
-
232
-
233
-
234
-
235
-
236
-
237
-
238
-
239
-
240
-
241
-
242
-
243
-
244
-
245
-
246
-
247
-
248
-
249
-
250
-
251
-
252
-
253
-
254
-
255
-
256
-
257
-
258
-
259
-
260
-
261
-
262
-
263
-
264
-
265
-
266
-
267
-
268
-
269
-
270
-
271
-
272
-
273
-
274
-
275
-
276
-
277
-
278
-
279
-
280
-
281
 |
 |

Table of Contents
US Airways Group, Inc.
Notes to Consolidated Financial Statements — (Continued)
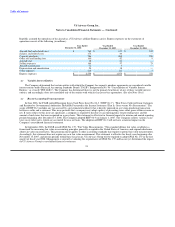
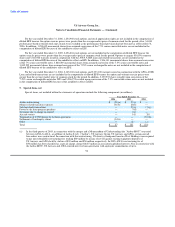
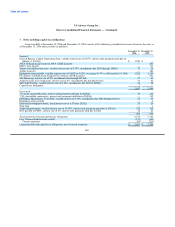
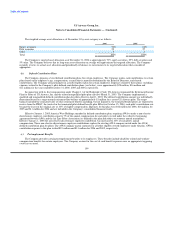
(c) Fair values of financial instruments
Cash Equivalents and Short-term Investments
Cash equivalents and short-term investments as of December 31 are classified as follows (in millions):
2006 2005
Cash and cash equivalents:
Corporate notes $ 731 $ 497
Cash and money market funds 385 628
Total cash and cash equivalents $ 1,116 $ 1,125
Short-term investments:
Held-to-maturity securities:
Corporate notes $ — $ 56
Available-for-sale securities:
Auction rate securities 1,249 396
Total short-term investments $ 1,249 $ 452
The carrying amount of cash equivalents approximates fair value because of the short-term nature of these instruments. All
held-to-maturity securities mature in one year or less. Contractual maturities for available-for-sale securities are greater than ten years
with a reset date approximately every 28 days. The carrying values of available-for-sale securities approximate fair value. There were no
unrealized gains or losses on these investments for the years ended December 31, 2006, 2005 and 2004 due to the frequent resetting of
interest rates on the auction rate securities. Gross proceeds from sales of available-for-sale securities for the years ended December 31,
2006, 2005 and 2004 were $749 million, $411 million and $589 million, respectively.
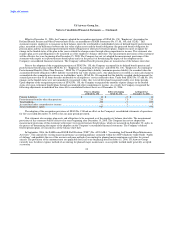
The Company had no long-term investments in debt securities as of December 31, 2006 and December 31, 2005.
Long-term Debt
At December 31, 2006 and 2005, the fair value of long-term debt was approximately $3.09 billion and $3.12 billion, respectively.
The Company's variable rate long-term debt with a carrying value of $1.94 billion and $1.85 billion at December 31, 2006 and 2005,
respectively, approximates fair value because these borrowings have variable interest rate terms that approximate market interest rates for
similar debt instruments. The fair value of the Company's other long-term debt is determined based on quoted market prices if available
or market prices for comparable debt instruments.
99