US Airways 2006 Annual Report Download - page 83
Download and view the complete annual report
Please find page 83 of the 2006 US Airways annual report below. You can navigate through the pages in the report by either clicking on the pages listed below, or by using the keyword search tool below to find specific information within the annual report.-
 1
1 -
2
-
3
-
4
-
5
-
6
-
7
-
8
-
9
-
10
-
11
-
12
-
13
-
14
-
15
-
16
-
17
-
18
-
19
-
20
-
21
-
22
-
23
-
24
-
25
-
26
-
27
-
28
-
29
-
30
-
31
-
32
-
33
-
34
-
35
-
36
-
37
-
38
-
39
-
40
-
41
-
42
-
43
-
44
-
45
-
46
-
47
-
48
-
49
-
50
-
51
-
52
-
53
-
54
-
55
-
56
-
57
-
58
-
59
-
60
-
61
-
62
-
63
-
64
-
65
-
66
-
67
-
68
-
69
-
70
-
71
-
72
-
 73
73 -
 74
74 -
 75
75 -
 76
76 -
 77
77 -
 78
78 -
 79
79 -
 80
80 -
 81
81 -
 82
82 -
 83
83 -
 84
84 -
 85
85 -
 86
86 -
 87
87 -
 88
88 -
 89
89 -
 90
90 -
 91
91 -
 92
92 -
 93
93 -
94
-
95
-
96
-
97
-
98
-
99
-
100
-
101
-
102
-
103
-
104
-
105
-
106
-
107
-
108
-
109
-
110
-
111
-
112
-
113
-
114
-
115
-
116
-
117
-
118
-
119
-
120
-
121
-
122
-
123
-
124
-
125
-
126
-
127
-
128
-
129
-
130
-
131
-
132
-
133
-
134
-
135
-
136
-
137
-
138
-
139
-
140
-
141
-
142
-
143
-
144
-
145
-
146
-
147
-
148
-
149
-
150
-
151
-
152
-
153
-
154
-
155
-
156
-
157
-
158
-
159
-
160
-
161
-
162
-
163
-
164
-
165
-
166
-
167
-
168
-
169
-
170
-
171
-
172
-
173
-
174
-
175
-
176
-
177
-
178
-
179
-
180
-
181
-
182
-
183
-
184
-
185
-
186
-
187
-
188
-
189
-
190
-
191
-
192
-
193
-
194
-
195
-
196
-
197
-
198
-
199
-
200
-
201
-
202
-
203
-
204
-
205
-
206
-
207
-
208
-
209
-
210
-
211
-
212
-
213
-
214
-
215
-
216
-
217
-
218
-
219
-
220
-
221
-
222
-
223
-
224
-
225
-
226
-
227
-
228
-
229
-
230
-
231
-
232
-
233
-
234
-
235
-
236
-
237
-
238
-
239
-
240
-
241
-
242
-
243
-
244
-
245
-
246
-
247
-
248
-
249
-
250
-
251
-
252
-
253
-
254
-
255
-
256
-
257
-
258
-
259
-
260
-
261
-
262
-
263
-
264
-
265
-
266
-
267
-
268
-
269
-
270
-
271
-
272
-
273
-
274
-
275
-
276
-
277
-
278
-
279
-
280
-
281
 |
 |

Table of Contents
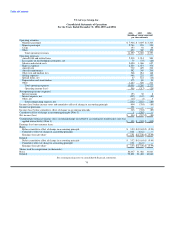
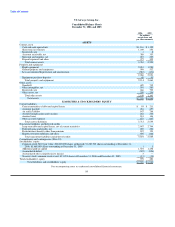
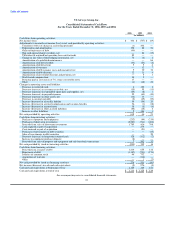
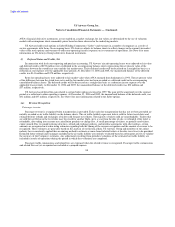
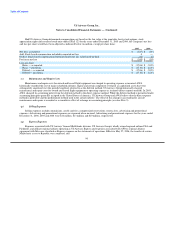
US Airways Group, Inc.
Consolidated Balance Sheets
December 31, 2006 and 2005
2006 2005
(In millions,
except share and
per share amounts)
ASSETS
Current assets
Cash and cash equivalents $ 1,116 $ 1,125
Short-term investments 1,249 452
Restricted cash 1 8
Accounts receivable, net 388 353
Materials and supplies, net 223 229
Prepaid expenses and other 377 392
Total current assets 3,354 2,559
Property and equipment
Flight equipment 2,051 1,920
Ground property and equipment 598 532
Less accumulated depreciation and amortization (583) (431)
2,066 2,021
Equipment purchase deposits 48 43
Total property and equipment 2,114 2,064
Other assets
Goodwill 629 732
Other intangibles, net 554 583
Restricted cash 666 792
Other assets, net 259 234
Total other assets 2,108 2,341
Total assets $ 7,576 $ 6,964
LIABILITIES & STOCKHOLDERS' EQUITY
Current liabilities
Current maturities of debt and capital leases $ 95 $ 211
Accounts payable 454 457
Air traffic liability 847 788
Accrued compensation and vacation 262 210
Accrued taxes 181 146
Other accrued expenses 873 847
Total current liabilities 2,712 2,659
Noncurrent liabilities and deferred credits
Long-term debt and capital leases, net of current maturities 2,907 2,794
Deferred gains and credits, net 205 254
Postretirement benefits other than pensions 187 193
Employee benefit liabilities and other 595 644
Total noncurrent liabilities and deferred credits 3,894 3,885
Commitments and contingencies (Note 10)
Stockholders' equity
Common stock, $0.01 par value; 200,000,000 shares authorized, 91,283,903 shares outstanding at December 31,
2006; 81,668,989 shares outstanding at December 31, 2005 1 1
Additional paid-in capital 1,501 1,258
Accumulated deficit (522) (826)
Accumulated other comprehensive income 3 —
Treasury stock, common stock at cost, 413,993 shares at December 31, 2006 and December 31, 2005 (13) (13)
Total stockholders' equity 970 420
Total liabilities and stockholders' equity $ 7,576 $ 6,964
See accompanying notes to condensed consolidated financial statements.
80