US Airways 2006 Annual Report Download - page 51
Download and view the complete annual report
Please find page 51 of the 2006 US Airways annual report below. You can navigate through the pages in the report by either clicking on the pages listed below, or by using the keyword search tool below to find specific information within the annual report.-
 1
1 -
2
-
3
-
4
-
5
-
6
-
7
-
8
-
9
-
10
-
11
-
12
-
13
-
14
-
15
-
16
-
17
-
18
-
19
-
20
-
21
-
22
-
23
-
24
-
25
-
26
-
27
-
28
-
29
-
30
-
31
-
32
-
33
-
34
-
35
-
36
-
37
-
38
-
39
-
40
-
 41
41 -
 42
42 -
 43
43 -
 44
44 -
 45
45 -
 46
46 -
 47
47 -
 48
48 -
 49
49 -
 50
50 -
 51
51 -
 52
52 -
 53
53 -
 54
54 -
 55
55 -
 56
56 -
 57
57 -
 58
58 -
 59
59 -
 60
60 -
 61
61 -
62
-
63
-
64
-
65
-
66
-
67
-
68
-
69
-
70
-
71
-
72
-
73
-
74
-
75
-
76
-
77
-
78
-
79
-
80
-
81
-
82
-
83
-
84
-
85
-
86
-
87
-
88
-
89
-
90
-
91
-
92
-
93
-
94
-
95
-
96
-
97
-
98
-
99
-
100
-
101
-
102
-
103
-
104
-
105
-
106
-
107
-
108
-
109
-
110
-
111
-
112
-
113
-
114
-
115
-
116
-
117
-
118
-
119
-
120
-
121
-
122
-
123
-
124
-
125
-
126
-
127
-
128
-
129
-
130
-
131
-
132
-
133
-
134
-
135
-
136
-
137
-
138
-
139
-
140
-
141
-
142
-
143
-
144
-
145
-
146
-
147
-
148
-
149
-
150
-
151
-
152
-
153
-
154
-
155
-
156
-
157
-
158
-
159
-
160
-
161
-
162
-
163
-
164
-
165
-
166
-
167
-
168
-
169
-
170
-
171
-
172
-
173
-
174
-
175
-
176
-
177
-
178
-
179
-
180
-
181
-
182
-
183
-
184
-
185
-
186
-
187
-
188
-
189
-
190
-
191
-
192
-
193
-
194
-
195
-
196
-
197
-
198
-
199
-
200
-
201
-
202
-
203
-
204
-
205
-
206
-
207
-
208
-
209
-
210
-
211
-
212
-
213
-
214
-
215
-
216
-
217
-
218
-
219
-
220
-
221
-
222
-
223
-
224
-
225
-
226
-
227
-
228
-
229
-
230
-
231
-
232
-
233
-
234
-
235
-
236
-
237
-
238
-
239
-
240
-
241
-
242
-
243
-
244
-
245
-
246
-
247
-
248
-
249
-
250
-
251
-
252
-
253
-
254
-
255
-
256
-
257
-
258
-
259
-
260
-
261
-
262
-
263
-
264
-
265
-
266
-
267
-
268
-
269
-
270
-
271
-
272
-
273
-
274
-
275
-
276
-
277
-
278
-
279
-
280
-
281
 |
 |
Table of Contents
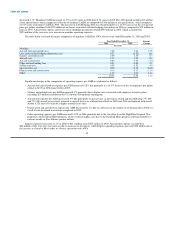
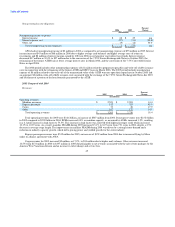
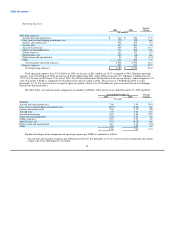
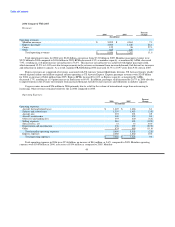
For the full year 2006, US Airways' operating revenues were $8.06 billion, operating income was $592 million and net income was
$345 million. The 2006 results include $21 million of net special charges, including $64 million of merger related transition expenses
offset in part by a credit of $40 million related to the Airbus restructuring and $3 million of gains associated with the settlement of
bankruptcy claims.
Operating revenues in 2005 were $7.21 billion, operating loss was $213 million and the net income was $160 million. The 2005
results include $15 million of net special charges related to merger related transition costs. Operating revenues for full year 2004 were
$7.07 billion, operating loss was $348 million and net loss was $578 million. US Airways' results from operations and the net income in
2005 and net loss in 2004 were significantly impacted by the bankruptcy proceedings, and the 2005 operating results also reflect the
impact of the merger with America West Holdings.
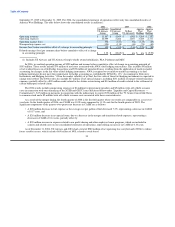
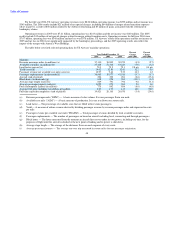
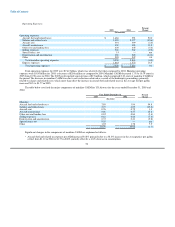
The table below sets forth selected operating data for US Airways' mainline operations.
Percent Percent
Year Ended December 31, Change Change
2006 2005 2004 2006-2005 2005-2004
Mainline:
Revenue passenger miles (in millions)(a) 37,130 38,895 39,970 (4.5) (2.7)
Available seat miles (in millions)(b) 47,428 51,518 53,229 (7.9) (3.2)
Load factor (percent)(c) 78.3 75.5 75.1 2.8 pts 0.4 pts
Yield (cents)(d) 14.02 12.50 12.43 12.2 0.6
Passenger revenue per available seat mile (cents)(e) 10.97 9.44 9.33 16.3 1.2
Passenger enplanements (in thousands)(f) 36,085 39,977 41,518 (9.7) (3.7)
Aircraft (end of period) 226 232 281 (2.6) (17.4)
Block hours (in thousands)(g) 818 928 961 (11.9) (3.4)
Average stage length (miles)(h) 869 791 792 9.8 (0.1)
Average passenger journey (miles)(i) 1,029 973 963 5.8 1.0
Fuel consumption (gallons in millions) 775 842 884 (8.0) (4.8)
Average fuel price including tax (dollars per gallon) 2.07 1.77 1.12 16.8 58.0
Full-time equivalent employees (end of period) 19,421 20,110 26,670 (3.4) (24.6)
(a) Revenue passenger mile ("RPM") — A basic measure of sales volume. It is one passenger flown one mile.
(b) Available seat mile ("ASM") — A basic measure of production. It is one seat flown one statute mile.
(c) Load factor — The percentage of available seats that are filled with revenue passengers.
(d) Yield — A measure of airline revenue derived by dividing passenger revenue by revenue passenger miles and expressed in cents
per mile.
(e) Passenger revenue per available seat mile ("PRASM") — Total passenger revenues divided by total available seat miles.
(f) Passenger enplanements — The number of passengers on board an aircraft including local, connecting and through passengers.
(g) Block hours — The hours measured from the moment an aircraft first moves under its own power, including taxi time, for the
purposes of flight until the aircraft is docked at the next point of landing and its power is shut down.
(h) Average stage length — The average of the distances flown on each segment of every route.
(i) Average passenger journey — The average one-way trip measured in statute miles for one passenger origination.
48