Sallie Mae 2015 Annual Report Download - page 95
Download and view the complete annual report
Please find page 95 of the 2015 Sallie Mae annual report below. You can navigate through the pages in the report by either clicking on the pages listed below, or by using the keyword search tool below to find specific information within the annual report.
F-5
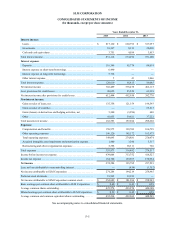
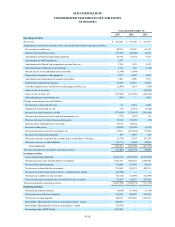
SLM CORPORATION
CONSOLIDATED STATEMENTS OF INCOME
(In thousands, except per share amounts)
Years Ended December 31,
2015 2014 2013
Interest income:
Loans. . . . . . . . . . . . . . . . . . . . . . . . . . . . . . . . . . . . . . . . . . . . . . . . . . $ 817,120 $ 660,792 $ 527,257
Investments . . . . . . . . . . . . . . . . . . . . . . . . . . . . . . . . . . . . . . . . . . . . . 10,247 8,913 20,090
Cash and cash equivalents. . . . . . . . . . . . . . . . . . . . . . . . . . . . . . . . . . 3,751 4,589 3,853
Total interest income . . . . . . . . . . . . . . . . . . . . . . . . . . . . . . . . . . . . . . . 831,118 674,294 551,200
Interest expense:
Deposits. . . . . . . . . . . . . . . . . . . . . . . . . . . . . . . . . . . . . . . . . . . . . . . . 116,386 95,774 88,019
Interest expense on short-term borrowings. . . . . . . . . . . . . . . . . . . . . 6,490 — —
Interest expense on long-term borrowings . . . . . . . . . . . . . . . . . . . . . 5,738 — —
Other interest expense. . . . . . . . . . . . . . . . . . . . . . . . . . . . . . . . . . . . . 5 41 1,066
Total interest expense. . . . . . . . . . . . . . . . . . . . . . . . . . . . . . . . . . . . . . . 128,619 95,815 89,085
Net interest income . . . . . . . . . . . . . . . . . . . . . . . . . . . . . . . . . . . . . . . . 702,499 578,479 462,115
Less: provisions for credit losses. . . . . . . . . . . . . . . . . . . . . . . . . . . . . . 90,055 85,529 69,339
Net interest income after provisions for credit losses . . . . . . . . . . . . . . 612,444 492,950 392,776
Non-interest income:
Gains on sales of loans, net. . . . . . . . . . . . . . . . . . . . . . . . . . . . . . . . . 135,358 121,359 196,593
Gains on sales of securities . . . . . . . . . . . . . . . . . . . . . . . . . . . . . . . . . — — 63,813
Gains (losses) on derivatives and hedging activities, net . . . . . . . . . . 5,300 (3,996) 640
Other . . . . . . . . . . . . . . . . . . . . . . . . . . . . . . . . . . . . . . . . . . . . . . . . . . 41,935 39,921 37,222
Total non-interest income . . . . . . . . . . . . . . . . . . . . . . . . . . . . . . . . . . . 182,593 157,284 298,268
Expenses:
Compensation and benefits . . . . . . . . . . . . . . . . . . . . . . . . . . . . . . . . . 158,975 129,709 106,799
Other operating expenses . . . . . . . . . . . . . . . . . . . . . . . . . . . . . . . . . . 190,120 145,172 163,675
Total operating expenses. . . . . . . . . . . . . . . . . . . . . . . . . . . . . . . . . . . 349,095 274,881 270,474
Acquired intangible asset impairment and amortization expense. . . . 1,480 3,290 3,317
Restructuring and other reorganization expenses . . . . . . . . . . . . . . . . 5,398 38,311 726
Total expenses . . . . . . . . . . . . . . . . . . . . . . . . . . . . . . . . . . . . . . . . . . . . 355,973 316,482 274,517
Income before income tax expense . . . . . . . . . . . . . . . . . . . . . . . . . . . . 439,064 333,752 416,527
Income tax expense . . . . . . . . . . . . . . . . . . . . . . . . . . . . . . . . . . . . . . . . 164,780 139,967 158,934
Net income . . . . . . . . . . . . . . . . . . . . . . . . . . . . . . . . . . . . . . . . . . . . . . 274,284 193,785 257,593
Less: net loss attributable to noncontrolling interest . . . . . . . . . . . . . . . — (434) (1,352)
Net income attributable to SLM Corporation . . . . . . . . . . . . . . . . . . . . 274,284 194,219 258,945
Preferred stock dividends. . . . . . . . . . . . . . . . . . . . . . . . . . . . . . . . . . . . 19,595 12,933 —
Net income attributable to SLM Corporation common stock . . . . . . . . $ 254,689 $ 181,286 $ 258,945
Basic earnings per common share attributable to SLM Corporation. . . $ 0.60 $ 0.43 $ 0.59
Average common shares outstanding. . . . . . . . . . . . . . . . . . . . . . . . . . . 425,574 423,970 440,108
Diluted earnings per common share attributable to SLM Corporation .$ 0.59 $ 0.42 $ 0.58
Average common and common equivalent shares outstanding. . . . . . . 432,234 432,269 448,549
See accompanying notes to consolidated financial statements.


