Sallie Mae 2015 Annual Report Download - page 52
Download and view the complete annual report
Please find page 52 of the 2015 Sallie Mae annual report below. You can navigate through the pages in the report by either clicking on the pages listed below, or by using the keyword search tool below to find specific information within the annual report.-
 1
1 -
2
-
3
-
4
-
5
-
6
-
7
-
8
-
9
-
10
-
11
-
12
-
13
-
14
-
15
-
16
-
17
-
18
-
19
-
20
-
21
-
22
-
23
-
24
-
25
-
26
-
27
-
28
-
29
-
30
-
31
-
32
-
33
-
34
-
35
-
36
-
37
-
38
-
39
-
40
-
41
-
 42
42 -
 43
43 -
 44
44 -
 45
45 -
 46
46 -
 47
47 -
 48
48 -
 49
49 -
 50
50 -
 51
51 -
 52
52 -
 53
53 -
 54
54 -
 55
55 -
 56
56 -
 57
57 -
 58
58 -
 59
59 -
 60
60 -
 61
61 -
 62
62 -
63
-
64
-
65
-
66
-
67
-
68
-
69
-
70
-
71
-
72
-
73
-
74
-
75
-
76
-
77
-
78
-
79
-
80
-
81
-
82
-
83
-
84
-
85
-
86
-
87
-
88
-
89
-
90
-
91
-
92
-
93
-
94
-
95
-
96
-
97
-
98
-
99
-
100
-
101
-
102
-
103
-
104
-
105
-
106
-
107
-
108
-
109
-
110
-
111
-
112
-
113
-
114
-
115
-
116
-
117
-
118
-
119
-
120
-
121
-
122
-
123
-
124
-
125
-
126
-
127
-
128
-
129
-
130
-
131
-
132
-
133
-
134
-
135
-
136
-
137
-
138
-
139
-
140
-
141
-
142
-
143
-
144
-
145
-
146
-
147
-
148
-
149
-
150
-
151
-
152
-
153
-
154
-
155
-
156
-
157
-
158
-
159
-
160
-
161
-
162
-
163
-
164
-
165
-
166
-
167
-
168
-
169
-
170
-
171
-
172
-
173
-
174
-
175
-
176
-
177
-
178
-
179
-
180
-
181
-
182
-
183
-
184
-
185
-
186
-
187
-
188
-
189
-
190
-
191
-
192
-
193
-
194
-
195
-
196
-
197
-
198
-
199
-
200
-
201
-
202
-
203
-
204
-
205
-
206
-
207
-
208
-
209
-
210
-
211
-
212
-
213
-
214
-
215
-
216
-
217
-
218
-
219
-
220
-
221
-
222
-
223
-
224
-
225
-
226
-
227
-
228
-
229
-
230
-
231
-
232
-
233
-
234
-
235
-
236
-
237
-
238
-
239
-
240
-
241
-
242
-
243
-
244
-
245
-
246
-
247
-
248
-
249
-
250
-
251
-
252
-
253
-
254
-
255
-
256
-
257
 |
 |

50
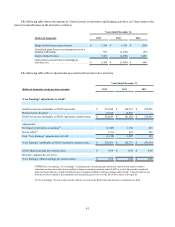
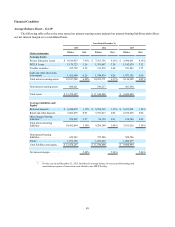
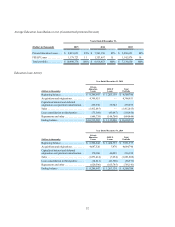
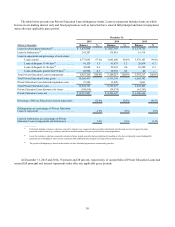
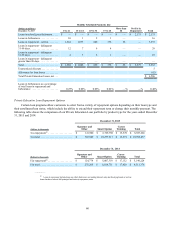
Rate/Volume Analysis - GAAP
The following rate/volume analysis shows the relative contribution of changes in interest rates and asset volumes.
(Dollars in thousands) Increase
(Decrease)
Change Due To(1)
Rate Volume
2015 vs. 2014
Interest income . . . . . . . . . . . . . . . . . . . . . . . . . . . . . . . . . $ 156,824 $ 40,302 $ 116,522
Interest expense . . . . . . . . . . . . . . . . . . . . . . . . . . . . . . . . 32,804 13,817 18,987
Net interest income. . . . . . . . . . . . . . . . . . . . . . . . . . . . . . $ 124,020 $ 24,943 $ 99,077
2014 vs. 2013
Interest income . . . . . . . . . . . . . . . . . . . . . . . . . . . . . . . . . $ 123,094 $ 9,270 $ 113,824
Interest expense . . . . . . . . . . . . . . . . . . . . . . . . . . . . . . . . 6,730 (8,468) 15,198
Net interest income. . . . . . . . . . . . . . . . . . . . . . . . . . . . . . $ 116,364 $ 17,738 $ 98,978
(1) Changes in income and expense due to both rate and volume have been allocated in proportion to the
relationship of the absolute dollar amounts of the change in each. The changes in income and expense are
calculated independently for each line in the table. The totals for the rate and volume columns are not the
sum of the individual lines.
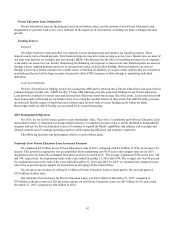
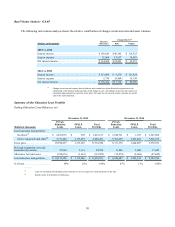
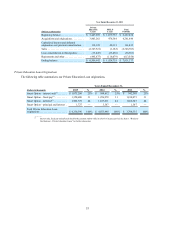
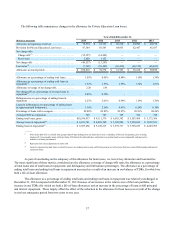
Summary of Our Education Loan Portfolio
Ending Education Loan Balances, net
December 31, 2015 December 31, 2014
(Dollars in thousands)
Private
Education
Loans FFELP
Loans Total
Portfolio
Private
Education
Loans FFELP
Loans Total
Portfolio
Total education loan portfolio:
In-school(1) . . . . . . . . . . . . . . . . $ 2,823,035 $ 582 $ 2,823,617 $ 2,548,721 $ 1,185 $ 2,549,906
Grace, repayment and other(2) .7,773,402 1,115,081 8,888,483 5,762,655 1,263,622 7,026,277
Total, gross . . . . . . . . . . . . . . . . . . 10,596,437 1,115,663 11,712,100 8,311,376 1,264,807 9,576,183
Deferred origination costs and
unamortized premium . . . . . . . . . . 27,884 3,114 30,998 13,845 3,600 17,445
Allowance for loan losses . . . . . . . (108,816) (3,691) (112,507) (78,574) (5,268) (83,842)
Total education loan portfolio. . . . $ 10,515,505 $ 1,115,086 $ 11,630,591 $ 8,246,647 $ 1,263,139 $ 9,509,786
% of total. . . . . . . . . . . . . . . . . . . . 90% 10% 100% 87% 13% 100%
_________
(1) Loans for customers still attending school and who are not yet required to make payments on the loan.
(2) Includes loans in deferment or forbearance.