Sallie Mae 2015 Annual Report Download - page 26
Download and view the complete annual report
Please find page 26 of the 2015 Sallie Mae annual report below. You can navigate through the pages in the report by either clicking on the pages listed below, or by using the keyword search tool below to find specific information within the annual report.-
 1
1 -
2
-
3
-
4
-
5
-
6
-
7
-
8
-
9
-
10
-
11
-
12
-
13
-
14
-
15
-
 16
16 -
 17
17 -
 18
18 -
 19
19 -
 20
20 -
 21
21 -
 22
22 -
 23
23 -
 24
24 -
 25
25 -
 26
26 -
 27
27 -
 28
28 -
 29
29 -
 30
30 -
 31
31 -
 32
32 -
 33
33 -
 34
34 -
 35
35 -
 36
36 -
37
-
38
-
39
-
40
-
41
-
42
-
43
-
44
-
45
-
46
-
47
-
48
-
49
-
50
-
51
-
52
-
53
-
54
-
55
-
56
-
57
-
58
-
59
-
60
-
61
-
62
-
63
-
64
-
65
-
66
-
67
-
68
-
69
-
70
-
71
-
72
-
73
-
74
-
75
-
76
-
77
-
78
-
79
-
80
-
81
-
82
-
83
-
84
-
85
-
86
-
87
-
88
-
89
-
90
-
91
-
92
-
93
-
94
-
95
-
96
-
97
-
98
-
99
-
100
-
101
-
102
-
103
-
104
-
105
-
106
-
107
-
108
-
109
-
110
-
111
-
112
-
113
-
114
-
115
-
116
-
117
-
118
-
119
-
120
-
121
-
122
-
123
-
124
-
125
-
126
-
127
-
128
-
129
-
130
-
131
-
132
-
133
-
134
-
135
-
136
-
137
-
138
-
139
-
140
-
141
-
142
-
143
-
144
-
145
-
146
-
147
-
148
-
149
-
150
-
151
-
152
-
153
-
154
-
155
-
156
-
157
-
158
-
159
-
160
-
161
-
162
-
163
-
164
-
165
-
166
-
167
-
168
-
169
-
170
-
171
-
172
-
173
-
174
-
175
-
176
-
177
-
178
-
179
-
180
-
181
-
182
-
183
-
184
-
185
-
186
-
187
-
188
-
189
-
190
-
191
-
192
-
193
-
194
-
195
-
196
-
197
-
198
-
199
-
200
-
201
-
202
-
203
-
204
-
205
-
206
-
207
-
208
-
209
-
210
-
211
-
212
-
213
-
214
-
215
-
216
-
217
-
218
-
219
-
220
-
221
-
222
-
223
-
224
-
225
-
226
-
227
-
228
-
229
-
230
-
231
-
232
-
233
-
234
-
235
-
236
-
237
-
238
-
239
-
240
-
241
-
242
-
243
-
244
-
245
-
246
-
247
-
248
-
249
-
250
-
251
-
252
-
253
-
254
-
255
-
256
-
257
 |
 |
24
Our allowance for loan losses may not be adequate to cover actual losses, and we may be required to materially increase our
allowance, which may adversely affect our capital, financial condition, and results of operations.
The evaluation of our allowance for loan losses is inherently subjective, as it requires material estimates that may be
subject to significant changes. As of December 31, 2015, our allowance for Private Education Loan losses was approximately
$109 million. During the year ended December 31, 2015, we recognized provisions for Private Education Loan losses of
$87 million. The provision for loan losses reflects the Private Education Loan performance for the applicable period and affects
the allowance at a level that management believes is appropriate to cover probable losses inherent in the loan portfolio.
However, future defaults can be higher than anticipated due to a variety of factors outside of our control, such as downturns in
the economy, regulatory or operational changes and other unforeseen future trends. Losses on Private Education Loans are also
determined by risk characteristics such as school type, loan status (in-school, grace, forbearance, repayment and delinquency),
loan seasoning (number of months in active repayment), underwriting criteria (e.g., credit scores), presence of a cosigner and
the current economic environment. General economic and employment conditions, including employment rates for recent
college graduates during the recent recession, led to higher rates of education loan defaults. In addition, our product offerings
may prove to be unprofitable and may result in higher than expected losses. If actual loan performance is worse than currently
estimated, it could materially increase our estimate of the allowance for loan losses in our balance sheet and the related
provision for loan losses in our statements of income and, as a result, adversely affect our capital, financial condition and results
of operations.
Changes in accounting standards could adversely affect our capital levels, results of operation and financial condition.
We are subject to the requirements of entities that set and interpret the accounting standards governing the preparation of
our financial statements and other financial reports. These entities, which include the Financial Accounting Standards Board
(“FASB”), the SEC, banking regulators and our independent registered public accounting firm, may add new requirements or
change their interpretations of how those standards should be applied.
For example, we anticipate the FASB will approve a final accounting standard in 2016 related to the calculation of loan
loss reserves that will require us to apply a current expected credit loss (“CECL”) model when recording impairment of loans
and other financial instruments. The CECL model, as currently drafted, will require us to record an allowance for estimated life
of loan losses at each balance sheet date. Currently, for those Private Education Loans that are not TDRs (as defined below),
we apply an inherent loss model and only record an allowance for losses expected to be realized in the 12 months following the
balance sheet date. Adoption of the CECL life of loan model could significantly increase our allowance for loan losses and
thereby materially affect our financial condition, results of operations, or capital levels.
The Bank is subject to various regulatory capital requirements administered by the FDIC and the UDFI. Failure to meet
minimum capital requirements can initiate certain mandatory and possibly additional discretionary actions by regulators
that, if undertaken, could have a material adverse effect on our business, results of operations and financial condition.
Under U.S. Basel III and the regulatory framework for prompt corrective action, the Bank must meet specific capital
standards that involve quantitative measures of its assets, liabilities and certain off-balance sheet items as calculated under
regulatory accounting practices. The Bank’s capital amounts and its classification under the prompt corrective action framework
are also subject to qualitative judgments by the regulators about components of capital, risk weightings and other factors.
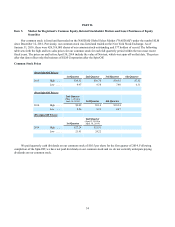
As of January 1, 2015, the Bank was required to comply with U.S. Basel III, which is aimed at increasing both the
quantity and quality of regulatory capital. U.S. Basel III establishes the following minimum capital ratios: a Common Equity
Tier 1 risk-based capital ratio of 4.5 percent, a Tier 1 risk-based capital ratio of 6.0 percent, a Total risk-based capital ratio of
8.0 percent, and a Tier 1 leverage ratio of 4.0 percent. In addition, on a fully phased-in basis by January 1, 2019, banks will be
subject to a greater than 2.5 percent Common Equity Tier 1 capital conservation buffer. Institutions that do not maintain the
buffer will face restrictions on dividend payments, share repurchases and the payment of discretionary bonuses to executive
officers.
U.S. Basel III also revised the capital thresholds for the prompt corrective action framework for insured depository
institutions. Effective January 1, 2015, to qualify as "well capitalized," an insured depository institution must maintain a
Common Equity Tier 1 risk-based capital ratio of at least 6.5 percent, a Tier 1 risk-based capital ratio of at least 8.0 percent, a
Total risk-based capital ratio of at least 10.0 percent, and a Tier 1 leverage ratio of at least 5.0 percent. As of December 31,