Sallie Mae 2015 Annual Report Download - page 82
Download and view the complete annual report
Please find page 82 of the 2015 Sallie Mae annual report below. You can navigate through the pages in the report by either clicking on the pages listed below, or by using the keyword search tool below to find specific information within the annual report.-
 1
1 -
2
-
3
-
4
-
5
-
6
-
7
-
8
-
9
-
10
-
11
-
12
-
13
-
14
-
15
-
16
-
17
-
18
-
19
-
20
-
21
-
22
-
23
-
24
-
25
-
26
-
27
-
28
-
29
-
30
-
31
-
32
-
33
-
34
-
35
-
36
-
37
-
38
-
39
-
40
-
41
-
42
-
43
-
44
-
45
-
46
-
47
-
48
-
49
-
50
-
51
-
52
-
53
-
54
-
55
-
56
-
57
-
58
-
59
-
60
-
61
-
62
-
63
-
64
-
65
-
66
-
67
-
68
-
69
-
70
-
71
-
 72
72 -
 73
73 -
 74
74 -
 75
75 -
 76
76 -
 77
77 -
 78
78 -
 79
79 -
 80
80 -
 81
81 -
 82
82 -
 83
83 -
 84
84 -
 85
85 -
 86
86 -
 87
87 -
 88
88 -
 89
89 -
 90
90 -
 91
91 -
 92
92 -
93
-
94
-
95
-
96
-
97
-
98
-
99
-
100
-
101
-
102
-
103
-
104
-
105
-
106
-
107
-
108
-
109
-
110
-
111
-
112
-
113
-
114
-
115
-
116
-
117
-
118
-
119
-
120
-
121
-
122
-
123
-
124
-
125
-
126
-
127
-
128
-
129
-
130
-
131
-
132
-
133
-
134
-
135
-
136
-
137
-
138
-
139
-
140
-
141
-
142
-
143
-
144
-
145
-
146
-
147
-
148
-
149
-
150
-
151
-
152
-
153
-
154
-
155
-
156
-
157
-
158
-
159
-
160
-
161
-
162
-
163
-
164
-
165
-
166
-
167
-
168
-
169
-
170
-
171
-
172
-
173
-
174
-
175
-
176
-
177
-
178
-
179
-
180
-
181
-
182
-
183
-
184
-
185
-
186
-
187
-
188
-
189
-
190
-
191
-
192
-
193
-
194
-
195
-
196
-
197
-
198
-
199
-
200
-
201
-
202
-
203
-
204
-
205
-
206
-
207
-
208
-
209
-
210
-
211
-
212
-
213
-
214
-
215
-
216
-
217
-
218
-
219
-
220
-
221
-
222
-
223
-
224
-
225
-
226
-
227
-
228
-
229
-
230
-
231
-
232
-
233
-
234
-
235
-
236
-
237
-
238
-
239
-
240
-
241
-
242
-
243
-
244
-
245
-
246
-
247
-
248
-
249
-
250
-
251
-
252
-
253
-
254
-
255
-
256
-
257
 |
 |
80
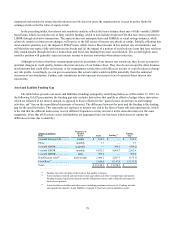
The “Funding Gap” in the above table shows primarily mismatches in the 1-month LIBOR, fixed-rate and 3-month
LIBOR categories. As changes in 1-month and 3-month LIBOR are generally quite highly correlated, the funding gap
associated with 3-month LIBOR is expected to partially offset the 1-month LIBOR gaps. We consider the overall risk to be
moderate since the funding in the Non-Discrete bucket is our liquid retail portfolio, which we have significant flexibility to
reprice at any time, and the funding in the fixed-rate bucket includes $1.7 billion of equity and $0.6 billion of non-interest
bearing liabilities.
We use interest rate swaps and other derivatives to achieve our risk management objectives. Our asset liability
management strategy is to match assets with debt (in combination with derivatives) that have the same underlying index and
reset frequency or have interest rate characteristics that we believe are highly correlated. The use of funding with index types
and reset frequencies that are different from our assets exposes us to interest rate risk in the form of basis and repricing risk.
This could result in our cost of funds not moving in the same direction or with the same magnitude as the yield on our assets.
While we believe this risk is low, as all of these indices are short-term with rate movements that are highly correlated over a
long period of time, market disruptions (which have occurred in recent years) can lead to a temporary divergence between
indices resulting in a negative impact to our earnings.
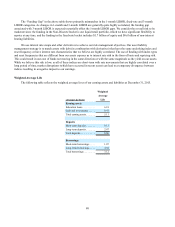
Weighted Average Life
The following table reflects the weighted average lives of our earning assets and liabilities at December 31, 2015.
Weighted
Average
(Averages in Years) Life
Earning assets
Education loans . . . . . . . . . . 6.18
Cash and investments . . . . . 0.47
Total earning assets. . . . . . . 5.11
Deposits
Short-term deposits . . . . . . . 0.13
Long-term deposits . . . . . . . 2.87
Total deposits. . . . . . . . . . . . 0.86
Borrowings
Short-term borrowings . . . . 1.07
Long-term borrowings. . . . . 4.86
Total borrowings . . . . . . . . . 3.12