Sallie Mae 2015 Annual Report Download - page 51
Download and view the complete annual report
Please find page 51 of the 2015 Sallie Mae annual report below. You can navigate through the pages in the report by either clicking on the pages listed below, or by using the keyword search tool below to find specific information within the annual report.-
 1
1 -
2
-
3
-
4
-
5
-
6
-
7
-
8
-
9
-
10
-
11
-
12
-
13
-
14
-
15
-
16
-
17
-
18
-
19
-
20
-
21
-
22
-
23
-
24
-
25
-
26
-
27
-
28
-
29
-
30
-
31
-
32
-
33
-
34
-
35
-
36
-
37
-
38
-
39
-
40
-
 41
41 -
 42
42 -
 43
43 -
 44
44 -
 45
45 -
 46
46 -
 47
47 -
 48
48 -
 49
49 -
 50
50 -
 51
51 -
 52
52 -
 53
53 -
 54
54 -
 55
55 -
 56
56 -
 57
57 -
 58
58 -
 59
59 -
 60
60 -
 61
61 -
62
-
63
-
64
-
65
-
66
-
67
-
68
-
69
-
70
-
71
-
72
-
73
-
74
-
75
-
76
-
77
-
78
-
79
-
80
-
81
-
82
-
83
-
84
-
85
-
86
-
87
-
88
-
89
-
90
-
91
-
92
-
93
-
94
-
95
-
96
-
97
-
98
-
99
-
100
-
101
-
102
-
103
-
104
-
105
-
106
-
107
-
108
-
109
-
110
-
111
-
112
-
113
-
114
-
115
-
116
-
117
-
118
-
119
-
120
-
121
-
122
-
123
-
124
-
125
-
126
-
127
-
128
-
129
-
130
-
131
-
132
-
133
-
134
-
135
-
136
-
137
-
138
-
139
-
140
-
141
-
142
-
143
-
144
-
145
-
146
-
147
-
148
-
149
-
150
-
151
-
152
-
153
-
154
-
155
-
156
-
157
-
158
-
159
-
160
-
161
-
162
-
163
-
164
-
165
-
166
-
167
-
168
-
169
-
170
-
171
-
172
-
173
-
174
-
175
-
176
-
177
-
178
-
179
-
180
-
181
-
182
-
183
-
184
-
185
-
186
-
187
-
188
-
189
-
190
-
191
-
192
-
193
-
194
-
195
-
196
-
197
-
198
-
199
-
200
-
201
-
202
-
203
-
204
-
205
-
206
-
207
-
208
-
209
-
210
-
211
-
212
-
213
-
214
-
215
-
216
-
217
-
218
-
219
-
220
-
221
-
222
-
223
-
224
-
225
-
226
-
227
-
228
-
229
-
230
-
231
-
232
-
233
-
234
-
235
-
236
-
237
-
238
-
239
-
240
-
241
-
242
-
243
-
244
-
245
-
246
-
247
-
248
-
249
-
250
-
251
-
252
-
253
-
254
-
255
-
256
-
257
 |
 |
49
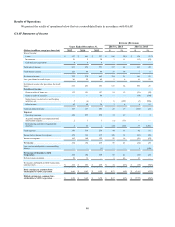
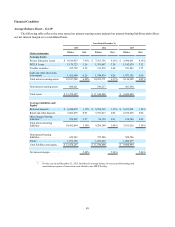
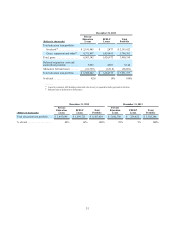
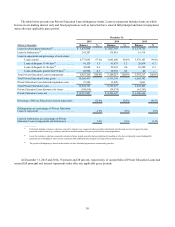
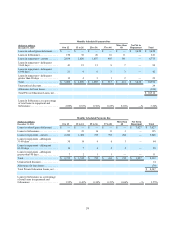
Financial Condition
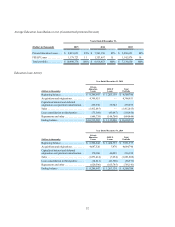
Average Balance Sheets - GAAP
The following table reflects the rates earned on interest-earning assets and paid on interest-bearing liabilities and reflects
our net interest margin on a consolidated basis.
Years Ended December 31,
2015 2014 2013
(Dollars in thousands) Balance
Rate
Balance
Rate
Balance
Rate
Average Assets
Private Education Loans . . . . $ 9,819,053 7.93% $ 7,563,356 8.16% $ 5,996,651 8.16%
FFELP Loans . . . . . . . . . . . . 1,179,723 3.26 1,353,497 3.24 1,142,979 3.32
Taxable securities . . . . . . . . . 395,720 2.59 331,479 2.68 523,883 3.75
Cash and other short-term
investments . . . . . . . . . . . . . . 1,423,090 0.26 1,746,839 0.26 1,473,392 0.30
Total interest-earning assets . 12,817,586 6.48% 10,995,171 6.13% 9,136,905 6.03%
Non-interest-earning assets. . 660,621 549,237 463,584
Total assets . . . . . . . . . . . . . . $ 13,478,207 $ 11,544,408 $ 9,600,489
Average Liabilities and
Equity
Brokered deposits . . . . . . . . . $ 6,640,078 1.19% $ 5,588,569 1.12% $ 5,015,201 1.24%
Retail and other deposits. . . . 3,862,879 0.95 3,593,817 0.92 2,675,879 0.96
Other interest-bearing
liabilities(1). . . . . . . . . . . . . . . 399,907 3.27 26,794 0.91 120,546 0.92
Total interest-bearing
liabilities . . . . . . . . . . . . . . . . 10,902,864 1.18% 9,209,180 1.04% 7,811,626 1.14%
Non-interest-bearing
liabilities . . . . . . . . . . . . . . . . 622,983 727,806 588,586
Equity . . . . . . . . . . . . . . . . . . 1,952,360 1,607,422 1,200,277
Total liabilities and equity. . . $ 13,478,207 $ 11,544,408 $ 9,600,489
Net interest margin . . . . . . . . 5.48% 5.26% 5.06%
_________________
(1) For the year ended December 31, 2015, includes the average balance of our secured borrowings and
amortization expense of transaction costs related to our ABCP Facility.