Sallie Mae 2015 Annual Report Download - page 125
Download and view the complete annual report
Please find page 125 of the 2015 Sallie Mae annual report below. You can navigate through the pages in the report by either clicking on the pages listed below, or by using the keyword search tool below to find specific information within the annual report.-
 1
1 -
2
-
3
-
4
-
5
-
6
-
7
-
8
-
9
-
10
-
11
-
12
-
13
-
14
-
15
-
16
-
17
-
18
-
19
-
20
-
21
-
22
-
23
-
24
-
25
-
26
-
27
-
28
-
29
-
30
-
31
-
32
-
33
-
34
-
35
-
36
-
37
-
38
-
39
-
40
-
41
-
42
-
43
-
44
-
45
-
46
-
47
-
48
-
49
-
50
-
51
-
52
-
53
-
54
-
55
-
56
-
57
-
58
-
59
-
60
-
61
-
62
-
63
-
64
-
65
-
66
-
67
-
68
-
69
-
70
-
71
-
72
-
73
-
74
-
75
-
76
-
77
-
78
-
79
-
80
-
81
-
82
-
83
-
84
-
85
-
86
-
87
-
88
-
89
-
90
-
91
-
92
-
93
-
94
-
95
-
96
-
97
-
98
-
99
-
100
-
101
-
102
-
103
-
104
-
105
-
106
-
107
-
108
-
109
-
110
-
111
-
112
-
113
-
114
-
 115
115 -
 116
116 -
 117
117 -
 118
118 -
 119
119 -
 120
120 -
 121
121 -
 122
122 -
 123
123 -
 124
124 -
 125
125 -
 126
126 -
 127
127 -
 128
128 -
 129
129 -
 130
130 -
 131
131 -
 132
132 -
 133
133 -
 134
134 -
 135
135 -
136
-
137
-
138
-
139
-
140
-
141
-
142
-
143
-
144
-
145
-
146
-
147
-
148
-
149
-
150
-
151
-
152
-
153
-
154
-
155
-
156
-
157
-
158
-
159
-
160
-
161
-
162
-
163
-
164
-
165
-
166
-
167
-
168
-
169
-
170
-
171
-
172
-
173
-
174
-
175
-
176
-
177
-
178
-
179
-
180
-
181
-
182
-
183
-
184
-
185
-
186
-
187
-
188
-
189
-
190
-
191
-
192
-
193
-
194
-
195
-
196
-
197
-
198
-
199
-
200
-
201
-
202
-
203
-
204
-
205
-
206
-
207
-
208
-
209
-
210
-
211
-
212
-
213
-
214
-
215
-
216
-
217
-
218
-
219
-
220
-
221
-
222
-
223
-
224
-
225
-
226
-
227
-
228
-
229
-
230
-
231
-
232
-
233
-
234
-
235
-
236
-
237
-
238
-
239
-
240
-
241
-
242
-
243
-
244
-
245
-
246
-
247
-
248
-
249
-
250
-
251
-
252
-
253
-
254
-
255
-
256
-
257
 |
 |
SLM CORPORATION
NOTES TO CONSOLIDATED FINANCIAL STATEMENTS (Continued)
(Dollars in thousands, unless otherwise noted)
6. Allowance for Loan Losses (Continued)
F-35
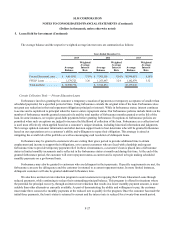
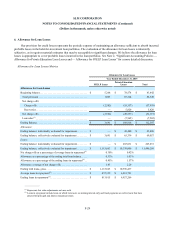
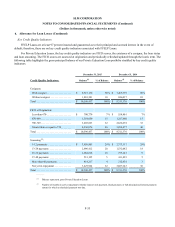
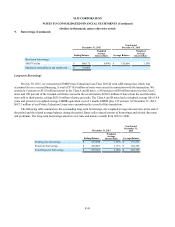
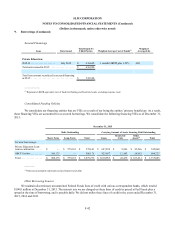
Key Credit Quality Indicators
FFELP Loans are at least 97 percent insured and guaranteed as to their principal and accrued interest in the event of
default; therefore, there are no key credit quality indicators associated with FFELP Loans.
For Private Education Loans, the key credit quality indicators are FICO scores, the existence of a cosigner, the loan status
and loan seasoning. The FICO scores are assessed at origination and periodically refreshed/updated through the loan's term. The
following table highlights the gross principal balance of our Private Education Loan portfolio stratified by key credit quality
indicators.
December 31, 2015 December 31, 2014
Credit Quality Indicators: Balance(1) % of Balance Balance(1) % of Balance
Cosigners:
With cosigner . . . . . . . . . . . . . . . . . . . $ 9,515,136 90% $ 7,465,339 90%
Without cosigner . . . . . . . . . . . . . . . . 1,081,301 10 846,037 10
Total . . . . . . . . . . . . . . . . . . . . . . . . . . . $ 10,596,437 100% $ 8,311,376 100%
FICO at Origination:
Less than 670 . . . . . . . . . . . . . . . . . . . $ 700,779 7% $ 558,801 7%
670-699. . . . . . . . . . . . . . . . . . . . . . . . 1,554,959 15 1,227,860 15
700-749. . . . . . . . . . . . . . . . . . . . . . . . 3,403,823 32 2,626,238 32
Greater than or equal to 750. . . . . . . . 4,936,876 46 3,898,477 46
Total . . . . . . . . . . . . . . . . . . . . . . . . . . . $ 10,596,437 100% $ 8,311,376 100%
Seasoning(2):
1-12 payments . . . . . . . . . . . . . . . . . . $ 3,059,901 29% $ 2,373,117 29%
13-24 payments . . . . . . . . . . . . . . . . . 2,096,412 20 1,532,042 18
25-36 payments . . . . . . . . . . . . . . . . . 1,084,818 10 755,143 9
37-48 payments . . . . . . . . . . . . . . . . . 513,125 5 411,493 5
More than 48 payments . . . . . . . . . . . 414,217 4 212,438 3
Not yet in repayment . . . . . . . . . . . . . 3,427,964 32 3,027,143 36
Total . . . . . . . . . . . . . . . . . . . . . . . . . . . $ 10,596,437 100% $ 8,311,376 100%
___________
(1) Balance represents gross Private Education Loans.
(2) Number of months in active repayment (whether interest only payment, fixed payment, or full principal and interest payment
status) for which a scheduled payment was due.