Sallie Mae 2015 Annual Report Download - page 64
Download and view the complete annual report
Please find page 64 of the 2015 Sallie Mae annual report below. You can navigate through the pages in the report by either clicking on the pages listed below, or by using the keyword search tool below to find specific information within the annual report.-
 1
1 -
2
-
3
-
4
-
5
-
6
-
7
-
8
-
9
-
10
-
11
-
12
-
13
-
14
-
15
-
16
-
17
-
18
-
19
-
20
-
21
-
22
-
23
-
24
-
25
-
26
-
27
-
28
-
29
-
30
-
31
-
32
-
33
-
34
-
35
-
36
-
37
-
38
-
39
-
40
-
41
-
42
-
43
-
44
-
45
-
46
-
47
-
48
-
49
-
50
-
51
-
52
-
53
-
 54
54 -
 55
55 -
 56
56 -
 57
57 -
 58
58 -
 59
59 -
 60
60 -
 61
61 -
 62
62 -
 63
63 -
 64
64 -
 65
65 -
 66
66 -
 67
67 -
 68
68 -
 69
69 -
 70
70 -
 71
71 -
 72
72 -
 73
73 -
 74
74 -
75
-
76
-
77
-
78
-
79
-
80
-
81
-
82
-
83
-
84
-
85
-
86
-
87
-
88
-
89
-
90
-
91
-
92
-
93
-
94
-
95
-
96
-
97
-
98
-
99
-
100
-
101
-
102
-
103
-
104
-
105
-
106
-
107
-
108
-
109
-
110
-
111
-
112
-
113
-
114
-
115
-
116
-
117
-
118
-
119
-
120
-
121
-
122
-
123
-
124
-
125
-
126
-
127
-
128
-
129
-
130
-
131
-
132
-
133
-
134
-
135
-
136
-
137
-
138
-
139
-
140
-
141
-
142
-
143
-
144
-
145
-
146
-
147
-
148
-
149
-
150
-
151
-
152
-
153
-
154
-
155
-
156
-
157
-
158
-
159
-
160
-
161
-
162
-
163
-
164
-
165
-
166
-
167
-
168
-
169
-
170
-
171
-
172
-
173
-
174
-
175
-
176
-
177
-
178
-
179
-
180
-
181
-
182
-
183
-
184
-
185
-
186
-
187
-
188
-
189
-
190
-
191
-
192
-
193
-
194
-
195
-
196
-
197
-
198
-
199
-
200
-
201
-
202
-
203
-
204
-
205
-
206
-
207
-
208
-
209
-
210
-
211
-
212
-
213
-
214
-
215
-
216
-
217
-
218
-
219
-
220
-
221
-
222
-
223
-
224
-
225
-
226
-
227
-
228
-
229
-
230
-
231
-
232
-
233
-
234
-
235
-
236
-
237
-
238
-
239
-
240
-
241
-
242
-
243
-
244
-
245
-
246
-
247
-
248
-
249
-
250
-
251
-
252
-
253
-
254
-
255
-
256
-
257
 |
 |
62
Liquidity and Capital Resources
Funding and Liquidity Risk Management
Our primary liquidity needs include our ongoing ability to fund our businesses throughout market cycles, including
during periods of financial stress, our ongoing ability to fund originations of Private Education Loans and servicing our Bank
deposits. To achieve these objectives, we analyze and monitor our liquidity needs, maintain excess liquidity and access diverse
funding sources, such as deposits at the Bank, issuance of secured debt primarily through asset-backed securitizations and other
financing facilities. It is our policy to manage operations so liquidity needs are fully satisfied through normal operations to
avoid unplanned asset sales under emergency conditions. Our liquidity management is governed by policies approved by our
Board of Directors. Oversight of these policies is performed in the Asset and Liability Committee, a management-level
committee.
These policies take into account the volatility of cash flow forecasts, expected maturities, anticipated loan demand and a
variety of other factors to establish minimum liquidity guidelines.
Key risks associated with our liquidity relate to our ability to access the capital markets and the markets for bank deposits
at reasonable rates. This ability may be affected by our performance, the macroeconomic environment and the impact they have
on the availability of funding sources in the marketplace.
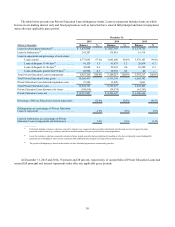
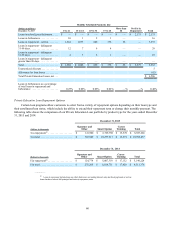
Sources of Liquidity and Available Capacity
Ending Balances
December 31,
(Dollars in thousands) 2015 2014 2013
Sources of primary liquidity:
Unrestricted cash and liquid investments:
Holding Company and other non-bank subsidiaries . . . . $ 9,817 $ 7,677 $ 1,052
Sallie Mae Bank(1) . . . . . . . . . . . . . . . . . . . . . . . . . . . . . . 2,406,402 2,352,103 2,181,813
Available-for-sale investments . . . . . . . . . . . . . . . . . . . . 195,391 168,934 102,105
Total unrestricted cash and liquid investments . . . . . . . . . $ 2,611,610 $ 2,528,714 $ 2,284,970
____
(1) This amount will be used primarily to originate Private Education Loans at the Bank.
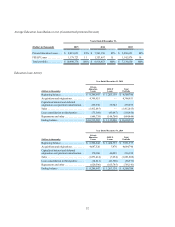
Average Balances
Years Ended December 31,
(Dollars in thousands) 2015 2014 2013
Sources of primary liquidity:
Unrestricted cash and liquid investments:
Holding Company and other non-bank subsidiaries . . . $ 17,241 $ 4,364 $ 1,176
Sallie Mae Bank(1) . . . . . . . . . . . . . . . . . . . . . . . . . . . . . 1,377,171 1,755,517 1,509,026
Available-for-sale investments. . . . . . . . . . . . . . . . . . . . 176,036 140,622 537,458
Total unrestricted cash and liquid investments. . . . . . . . . $ 1,570,448 $ 1,900,503 $ 2,047,660
____
(1) This amount will be used primarily to originate Private Education Loans at the Bank.