Sallie Mae 2015 Annual Report Download - page 94
Download and view the complete annual report
Please find page 94 of the 2015 Sallie Mae annual report below. You can navigate through the pages in the report by either clicking on the pages listed below, or by using the keyword search tool below to find specific information within the annual report.-
 1
1 -
2
-
3
-
4
-
5
-
6
-
7
-
8
-
9
-
10
-
11
-
12
-
13
-
14
-
15
-
16
-
17
-
18
-
19
-
20
-
21
-
22
-
23
-
24
-
25
-
26
-
27
-
28
-
29
-
30
-
31
-
32
-
33
-
34
-
35
-
36
-
37
-
38
-
39
-
40
-
41
-
42
-
43
-
44
-
45
-
46
-
47
-
48
-
49
-
50
-
51
-
52
-
53
-
54
-
55
-
56
-
57
-
58
-
59
-
60
-
61
-
62
-
63
-
64
-
65
-
66
-
67
-
68
-
69
-
70
-
71
-
72
-
73
-
74
-
75
-
76
-
77
-
78
-
79
-
80
-
81
-
82
-
83
-
 84
84 -
 85
85 -
 86
86 -
 87
87 -
 88
88 -
 89
89 -
 90
90 -
 91
91 -
 92
92 -
 93
93 -
 94
94 -
 95
95 -
 96
96 -
 97
97 -
 98
98 -
 99
99 -
 100
100 -
 101
101 -
 102
102 -
 103
103 -
 104
104 -
105
-
106
-
107
-
108
-
109
-
110
-
111
-
112
-
113
-
114
-
115
-
116
-
117
-
118
-
119
-
120
-
121
-
122
-
123
-
124
-
125
-
126
-
127
-
128
-
129
-
130
-
131
-
132
-
133
-
134
-
135
-
136
-
137
-
138
-
139
-
140
-
141
-
142
-
143
-
144
-
145
-
146
-
147
-
148
-
149
-
150
-
151
-
152
-
153
-
154
-
155
-
156
-
157
-
158
-
159
-
160
-
161
-
162
-
163
-
164
-
165
-
166
-
167
-
168
-
169
-
170
-
171
-
172
-
173
-
174
-
175
-
176
-
177
-
178
-
179
-
180
-
181
-
182
-
183
-
184
-
185
-
186
-
187
-
188
-
189
-
190
-
191
-
192
-
193
-
194
-
195
-
196
-
197
-
198
-
199
-
200
-
201
-
202
-
203
-
204
-
205
-
206
-
207
-
208
-
209
-
210
-
211
-
212
-
213
-
214
-
215
-
216
-
217
-
218
-
219
-
220
-
221
-
222
-
223
-
224
-
225
-
226
-
227
-
228
-
229
-
230
-
231
-
232
-
233
-
234
-
235
-
236
-
237
-
238
-
239
-
240
-
241
-
242
-
243
-
244
-
245
-
246
-
247
-
248
-
249
-
250
-
251
-
252
-
253
-
254
-
255
-
256
-
257
 |
 |
F-4
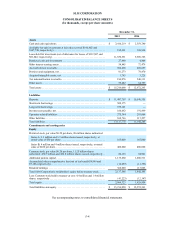
SLM CORPORATION
CONSOLIDATED BALANCE SHEETS
(In thousands, except per share amounts)
December 31,
2015 2014
Assets
Cash and cash equivalents. . . . . . . . . . . . . . . . . . . . . . . . . . . . . . . . . . . . . . $ 2,416,219 $ 2,359,780
Available-for-sale investments at fair value (cost of $196,402 and
$167,740, respectively) . . . . . . . . . . . . . . . . . . . . . . . . . . . . . . . . . . . . . . . . 195,391 168,934
Loans held for investment (net of allowance for losses of $112,507 and
$83,842, respectively) . . . . . . . . . . . . . . . . . . . . . . . . . . . . . . . . . . . . . . . . . 11,630,591 9,509,786
Restricted cash and investments . . . . . . . . . . . . . . . . . . . . . . . . . . . . . . . . . 27,980 4,804
Other interest-earning assets . . . . . . . . . . . . . . . . . . . . . . . . . . . . . . . . . . . . 54,845 72,479
Accrued interest receivable. . . . . . . . . . . . . . . . . . . . . . . . . . . . . . . . . . . . . 564,496 469,697
Premises and equipment, net. . . . . . . . . . . . . . . . . . . . . . . . . . . . . . . . . . . . 81,273 78,470
Acquired intangible assets, net . . . . . . . . . . . . . . . . . . . . . . . . . . . . . . . . . . 1,745 3,225
Tax indemnification receivable. . . . . . . . . . . . . . . . . . . . . . . . . . . . . . . . . . 186,076 240,311
Other assets . . . . . . . . . . . . . . . . . . . . . . . . . . . . . . . . . . . . . . . . . . . . . . . . . 55,482 64,757
Total assets . . . . . . . . . . . . . . . . . . . . . . . . . . . . . . . . . . . . . . . . . . . . . . . . . $ 15,214,098 $ 12,972,243
Liabilities
Deposits. . . . . . . . . . . . . . . . . . . . . . . . . . . . . . . . . . . . . . . . . . . . . . . . . . . . $ 11,487,707 $ 10,540,555
Short-term borrowings . . . . . . . . . . . . . . . . . . . . . . . . . . . . . . . . . . . . . . . . 500,175 —
Long-term borrowings. . . . . . . . . . . . . . . . . . . . . . . . . . . . . . . . . . . . . . . . . 579,101 —
Income taxes payable, net . . . . . . . . . . . . . . . . . . . . . . . . . . . . . . . . . . . . . . 166,662 191,499
Upromise related liabilities . . . . . . . . . . . . . . . . . . . . . . . . . . . . . . . . . . . . . 275,384 293,004
Other liabilities . . . . . . . . . . . . . . . . . . . . . . . . . . . . . . . . . . . . . . . . . . . . . . 108,746 117,227
Total liabilities. . . . . . . . . . . . . . . . . . . . . . . . . . . . . . . . . . . . . . . . . . . . . . . 13,117,775 11,142,285
Commitments and contingencies
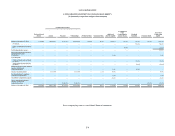
Equity
Preferred stock, par value $0.20 per share, 20 million shares authorized
Series A: 3.3 million and 3.3 million shares issued, respectively, at
stated value of $50 per share . . . . . . . . . . . . . . . . . . . . . . . . . . . . . . . . . . 165,000 165,000
Series B: 4 million and 4 million shares issued, respectively, at stated
value of $100 per share. . . . . . . . . . . . . . . . . . . . . . . . . . . . . . . . . . . . . . . 400,000 400,000
Common stock, par value $0.20 per share, 1.125 billion shares
authorized: 430.7 million and 424.8 million shares, issued, respectively. . 86,136 84,961
Additional paid-in capital . . . . . . . . . . . . . . . . . . . . . . . . . . . . . . . . . . . . . . 1,135,860 1,090,511
Accumulated other comprehensive loss (net of tax benefit $9,949 and
$7,186, respectively) . . . . . . . . . . . . . . . . . . . . . . . . . . . . . . . . . . . . . . . . . . (16,059) (11,393)
Retained earnings . . . . . . . . . . . . . . . . . . . . . . . . . . . . . . . . . . . . . . . . . . . . 366,609 113,066
Total SLM Corporation's stockholders' equity before treasury stock. . . . . 2,137,546 1,842,145
Less: Common stock held in treasury at cost: 4.4 million and 1.4 million
shares, respectively . . . . . . . . . . . . . . . . . . . . . . . . . . . . . . . . . . . . . . . . . . . (41,223) (12,187)
Total equity . . . . . . . . . . . . . . . . . . . . . . . . . . . . . . . . . . . . . . . . . . . . . . . . . 2,096,323 1,829,958
Total liabilities and equity. . . . . . . . . . . . . . . . . . . . . . . . . . . . . . . . . . . . . . $ 15,214,098 $ 12,972,243
See accompanying notes to consolidated financial statements.