Sallie Mae 2015 Annual Report Download - page 41
Download and view the complete annual report
Please find page 41 of the 2015 Sallie Mae annual report below. You can navigate through the pages in the report by either clicking on the pages listed below, or by using the keyword search tool below to find specific information within the annual report.-
 1
1 -
2
-
3
-
4
-
5
-
6
-
7
-
8
-
9
-
10
-
11
-
12
-
13
-
14
-
15
-
16
-
17
-
18
-
19
-
20
-
21
-
22
-
23
-
24
-
25
-
26
-
27
-
28
-
29
-
30
-
 31
31 -
 32
32 -
 33
33 -
 34
34 -
 35
35 -
 36
36 -
 37
37 -
 38
38 -
 39
39 -
 40
40 -
 41
41 -
 42
42 -
 43
43 -
 44
44 -
 45
45 -
 46
46 -
 47
47 -
 48
48 -
 49
49 -
 50
50 -
 51
51 -
52
-
53
-
54
-
55
-
56
-
57
-
58
-
59
-
60
-
61
-
62
-
63
-
64
-
65
-
66
-
67
-
68
-
69
-
70
-
71
-
72
-
73
-
74
-
75
-
76
-
77
-
78
-
79
-
80
-
81
-
82
-
83
-
84
-
85
-
86
-
87
-
88
-
89
-
90
-
91
-
92
-
93
-
94
-
95
-
96
-
97
-
98
-
99
-
100
-
101
-
102
-
103
-
104
-
105
-
106
-
107
-
108
-
109
-
110
-
111
-
112
-
113
-
114
-
115
-
116
-
117
-
118
-
119
-
120
-
121
-
122
-
123
-
124
-
125
-
126
-
127
-
128
-
129
-
130
-
131
-
132
-
133
-
134
-
135
-
136
-
137
-
138
-
139
-
140
-
141
-
142
-
143
-
144
-
145
-
146
-
147
-
148
-
149
-
150
-
151
-
152
-
153
-
154
-
155
-
156
-
157
-
158
-
159
-
160
-
161
-
162
-
163
-
164
-
165
-
166
-
167
-
168
-
169
-
170
-
171
-
172
-
173
-
174
-
175
-
176
-
177
-
178
-
179
-
180
-
181
-
182
-
183
-
184
-
185
-
186
-
187
-
188
-
189
-
190
-
191
-
192
-
193
-
194
-
195
-
196
-
197
-
198
-
199
-
200
-
201
-
202
-
203
-
204
-
205
-
206
-
207
-
208
-
209
-
210
-
211
-
212
-
213
-
214
-
215
-
216
-
217
-
218
-
219
-
220
-
221
-
222
-
223
-
224
-
225
-
226
-
227
-
228
-
229
-
230
-
231
-
232
-
233
-
234
-
235
-
236
-
237
-
238
-
239
-
240
-
241
-
242
-
243
-
244
-
245
-
246
-
247
-
248
-
249
-
250
-
251
-
252
-
253
-
254
-
255
-
256
-
257
 |
 |
39
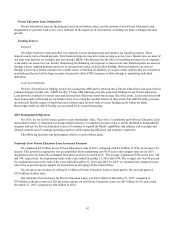
Loan Sales and Secured Financings
We may sell Private Education Loans to third-parties through an auction process. We retain servicing of these Private
Education Loans subsequent to their sale and earn revenue for this servicing at prevailing market rates for such services. Selling
Private Education Loans removes the loan assets from our balance sheet and helps us manage our asset growth, capital and
liquidity needs. Alternatively, we may use Private Education Loans as collateral in connection with the creation of asset-backed
securitizations or securitized commercial paper facilities structured as financings. These types of transactions may provide us
long-term financing, but they do not remove Private Education Loan assets from our balance sheet, nor do they generate gains
on sales of loans, net. Consequently, our operating results may be significantly affected by whether we choose to sell loans and
recognize current gains on sale or continue to hold or finance loans, thereby retaining some or all of the net interest income
from those loans. See Notes to Consolidated Financial Statements, Note 10, “Private Education Loan Term Securitizations,” for
further discussion regarding these transactions. We currently do not expect to sell additional loans in 2016, as loan sales
subsequent to the Spin-Off have generated sufficient capital to support our expected growth for the year.
Allowance for Loan Losses
Management estimates and maintains an allowance for loan losses for Private Education Loans at a level sufficient to
cover charge-offs expected over the next year, plus an additional allowance to cover life-of-loan expected losses for loans
classified as a troubled debt restructuring (“TDR”). Allowances for loan losses are an important indicator of management’s
perspective on the future performance of a loan portfolio. Each quarter, management makes an adjustment to the allowance for
loan losses for Private Education Loans to reflect its most up-to-date estimate of future losses by recording a charge against
quarterly revenues known as provision expense. As they occur, actual loan charge-offs and recoveries are then charged against
the allowance for loan losses for Private Education Loans rather than against earnings.
The allowance for loan losses and provision expense rise when future charge-offs are expected to increase and fall when
charge-offs are expected to decline. We bear the full credit exposure on our Private Education Loans. Losses on our Private
Education Loans are affected by risk characteristics such as loan status (in-school, grace, forbearance, repayment and
delinquency), loan seasoning (number of months in active repayment), underwriting criteria (e.g., credit scores), presence of a
cosigner and the current economic environment. Losses typically emerge once a borrower separates from school and enters full
principal and interest repayment after the borrower's six month grace period ends. Our experience indicates that approximately
50 percent of expected losses on loans occur in the first two years after a loan enters full principal and interest repayment.
Therefore, changes in our allowance for loan losses will be driven in large measure by the amount and age of our loans in full
principal and interest repayment. As a larger proportion of our portfolio enters full principal and interest repayment in the
coming years, we would expect charge-offs to increase and the amount of TDRs to increase as well.
Our allowance for loan losses for FFELP Loans and related periodic provision expense are small because we generally
bear a maximum of three percent loss exposure due to the federal guarantee. We maintain an allowance for loan losses for our
FFELP Loans at a level sufficient to cover charge-offs expected over the next two years.
Charge-Offs and Delinquencies
Delinquencies are another important indicator of potential future credit performance. When a Private Education Loan
reaches 120 days delinquent, it is charged against the allowance for loan losses. Charge-off data provides relevant information
with respect to the actual performance of a loan portfolio over time. Management focuses on delinquencies as well as the
progression of loans from early to late stage delinquency as a key metric in estimating the allowance for loan losses and
tailoring its future collections strategies. Prior to the Spin-Off, the Bank would sell delinquent loans to an entity that is now a
subsidiary of Navient when the loans became 90 days delinquent. As a result, there were no charge-offs recorded against our
allowance for loan losses prior to April 1, 2014. In addition, because loans were sold earlier in their delinquency status prior to
the Spin-Off, delinquency statistics for those periods are not comparable to those post-Spin-Off and are not indicative of
expected future performance. Since the Spin-Off, the Bank has been responsible for collecting all delinquent loans and, until
recently, all charged-off loans were sold to a third-party. In November 2015, we began to retain and collect charged-off loans
using our own personnel. The levels of delinquencies since the Spin-Off have been additionally affected somewhat by these
changes in collection approach. In the future, we expect to manage our charged-off loans through a mix of in-house collectors,
third-party collectors and third-party sales.