Sallie Mae 2015 Annual Report Download - page 48
Download and view the complete annual report
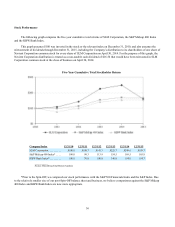
Please find page 48 of the 2015 Sallie Mae annual report below. You can navigate through the pages in the report by either clicking on the pages listed below, or by using the keyword search tool below to find specific information within the annual report.-
 1
1 -
2
-
3
-
4
-
5
-
6
-
7
-
8
-
9
-
10
-
11
-
12
-
13
-
14
-
15
-
16
-
17
-
18
-
19
-
20
-
21
-
22
-
23
-
24
-
25
-
26
-
27
-
28
-
29
-
30
-
31
-
32
-
33
-
34
-
35
-
36
-
37
-
 38
38 -
 39
39 -
 40
40 -
 41
41 -
 42
42 -
 43
43 -
 44
44 -
 45
45 -
 46
46 -
 47
47 -
 48
48 -
 49
49 -
 50
50 -
 51
51 -
 52
52 -
 53
53 -
 54
54 -
 55
55 -
 56
56 -
 57
57 -
 58
58 -
59
-
60
-
61
-
62
-
63
-
64
-
65
-
66
-
67
-
68
-
69
-
70
-
71
-
72
-
73
-
74
-
75
-
76
-
77
-
78
-
79
-
80
-
81
-
82
-
83
-
84
-
85
-
86
-
87
-
88
-
89
-
90
-
91
-
92
-
93
-
94
-
95
-
96
-
97
-
98
-
99
-
100
-
101
-
102
-
103
-
104
-
105
-
106
-
107
-
108
-
109
-
110
-
111
-
112
-
113
-
114
-
115
-
116
-
117
-
118
-
119
-
120
-
121
-
122
-
123
-
124
-
125
-
126
-
127
-
128
-
129
-
130
-
131
-
132
-
133
-
134
-
135
-
136
-
137
-
138
-
139
-
140
-
141
-
142
-
143
-
144
-
145
-
146
-
147
-
148
-
149
-
150
-
151
-
152
-
153
-
154
-
155
-
156
-
157
-
158
-
159
-
160
-
161
-
162
-
163
-
164
-
165
-
166
-
167
-
168
-
169
-
170
-
171
-
172
-
173
-
174
-
175
-
176
-
177
-
178
-
179
-
180
-
181
-
182
-
183
-
184
-
185
-
186
-
187
-
188
-
189
-
190
-
191
-
192
-
193
-
194
-
195
-
196
-
197
-
198
-
199
-
200
-
201
-
202
-
203
-
204
-
205
-
206
-
207
-
208
-
209
-
210
-
211
-
212
-
213
-
214
-
215
-
216
-
217
-
218
-
219
-
220
-
221
-
222
-
223
-
224
-
225
-
226
-
227
-
228
-
229
-
230
-
231
-
232
-
233
-
234
-
235
-
236
-
237
-
238
-
239
-
240
-
241
-
242
-
243
-
244
-
245
-
246
-
247
-
248
-
249
-
250
-
251
-
252
-
253
-
254
-
255
-
256
-
257
 |
 |
46
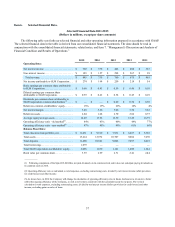
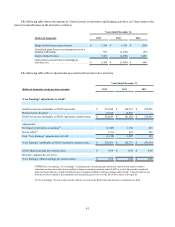
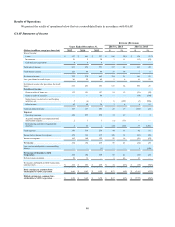
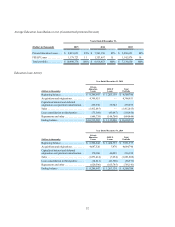
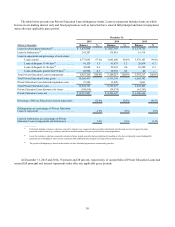
Results of Operations
We present the results of operations below first on a consolidated basis in accordance with GAAP.
GAAP Statements of Income
Increase (Decrease)
Years Ended December 31, 2015 vs. 2014 2014 vs. 2013
(Dollars in millions, except per share data) 2015 2014 2013 $ % $ %
Interest income:
Loans. . . . . . . . . . . . . . . . . . . . . . . . . . . . . . . $ 817 $ 661 $ 527 $ 156 24% $ 134 25 %
Investments. . . . . . . . . . . . . . . . . . . . . . . . . . 10 9 20 1 11 (11) (55)
Cash and cash equivalents . . . . . . . . . . . . . . 4 4 4 — — — —
Total interest income . . . . . . . . . . . . . . . . . . . . 831 674 551 157 23 123 22
Total interest expense. . . . . . . . . . . . . . . . . . . . 129 96 89 33 34 7 8
Net interest income . . . . . . . . . . . . . . . . . . . . . 702 578 462 124 21 116 25
Less: provisions for credit losses . . . . . . . . . . . 90 85 69 5 6 16 23
Net interest income after provisions for credit
losses . . . . . . . . . . . . . . . . . . . . . . . . . . . . . . . . 612 493 393 119 24 100 25
Non-interest income:
Gains on sales of loans, net. . . . . . . . . . . . . . 135 121 197 14 12 (76) (39)
Gains on sales of securities. . . . . . . . . . . . . . — — 64 — — (64) (100)
Gains (losses) on derivatives and hedging
activities, net. . . . . . . . . . . . . . . . . . . . . . . . . 5 (4) 1 9 (225)(5) (500)
Other income . . . . . . . . . . . . . . . . . . . . . . . . 43 40 36 3 8 4 11
Total non-interest income. . . . . . . . . . . . . . . . . 183 157 298 26 17 (141) (47)
Expenses:
Operating expenses. . . . . . . . . . . . . . . . . . . . 349 275 270 74 27 5 2
Acquired intangible asset impairment and
amortization expense . . . . . . . . . . . . . . . . . . 2 3 3 (1)(33) — —
Restructuring and other reorganization
expenses . . . . . . . . . . . . . . . . . . . . . . . . . . . . 5 38 1 (33)(87) 37 3,700
Total expenses . . . . . . . . . . . . . . . . . . . . . . . . . 356 316 274 40 13 42 15
Income before income tax expense . . . . . . . . . 439 334 417 105 31 (83) (20)
Income tax expense . . . . . . . . . . . . . . . . . . . . . 165 140 159 25 18 (19) (12)
Net income. . . . . . . . . . . . . . . . . . . . . . . . . . . . 274 194 258 80 41 (64) (25)
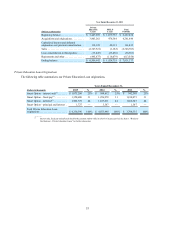
Less: net loss attributable to noncontrolling
interest . . . . . . . . . . . . . . . . . . . . . . . . . . . . . . . — — (1) — — 1 (100)
Net income attributable to SLM
Corporation . . . . . . . . . . . . . . . . . . . . . . . . . . 274 194 259 80 41 (65) (25)
Preferred stock dividends. . . . . . . . . . . . . . . . . 19 13 — 6 46 13 —
Net income attributable to SLM Corporation
common stock . . . . . . . . . . . . . . . . . . . . . . . . . $ 255 $ 181 $ 259 $ 74 41% $ (78) (30)%
Basic earnings per common share
attributable to SLM Corporation. . . . . . . . . $ 0.60 $ 0.43 $ 0.59 $ 0.17 40% $ (0.16) (27)%
Diluted earnings per common share
attributable to SLM Corporation. . . . . . . . . $ 0.59 $ 0.42 $ 0.58 $ 0.17 40% $ (0.16) (28)%