Sallie Mae 2015 Annual Report Download - page 59
Download and view the complete annual report
Please find page 59 of the 2015 Sallie Mae annual report below. You can navigate through the pages in the report by either clicking on the pages listed below, or by using the keyword search tool below to find specific information within the annual report.-
 1
1 -
2
-
3
-
4
-
5
-
6
-
7
-
8
-
9
-
10
-
11
-
12
-
13
-
14
-
15
-
16
-
17
-
18
-
19
-
20
-
21
-
22
-
23
-
24
-
25
-
26
-
27
-
28
-
29
-
30
-
31
-
32
-
33
-
34
-
35
-
36
-
37
-
38
-
39
-
40
-
41
-
42
-
43
-
44
-
45
-
46
-
47
-
48
-
 49
49 -
 50
50 -
 51
51 -
 52
52 -
 53
53 -
 54
54 -
 55
55 -
 56
56 -
 57
57 -
 58
58 -
 59
59 -
 60
60 -
 61
61 -
 62
62 -
 63
63 -
 64
64 -
 65
65 -
 66
66 -
 67
67 -
 68
68 -
 69
69 -
70
-
71
-
72
-
73
-
74
-
75
-
76
-
77
-
78
-
79
-
80
-
81
-
82
-
83
-
84
-
85
-
86
-
87
-
88
-
89
-
90
-
91
-
92
-
93
-
94
-
95
-
96
-
97
-
98
-
99
-
100
-
101
-
102
-
103
-
104
-
105
-
106
-
107
-
108
-
109
-
110
-
111
-
112
-
113
-
114
-
115
-
116
-
117
-
118
-
119
-
120
-
121
-
122
-
123
-
124
-
125
-
126
-
127
-
128
-
129
-
130
-
131
-
132
-
133
-
134
-
135
-
136
-
137
-
138
-
139
-
140
-
141
-
142
-
143
-
144
-
145
-
146
-
147
-
148
-
149
-
150
-
151
-
152
-
153
-
154
-
155
-
156
-
157
-
158
-
159
-
160
-
161
-
162
-
163
-
164
-
165
-
166
-
167
-
168
-
169
-
170
-
171
-
172
-
173
-
174
-
175
-
176
-
177
-
178
-
179
-
180
-
181
-
182
-
183
-
184
-
185
-
186
-
187
-
188
-
189
-
190
-
191
-
192
-
193
-
194
-
195
-
196
-
197
-
198
-
199
-
200
-
201
-
202
-
203
-
204
-
205
-
206
-
207
-
208
-
209
-
210
-
211
-
212
-
213
-
214
-
215
-
216
-
217
-
218
-
219
-
220
-
221
-
222
-
223
-
224
-
225
-
226
-
227
-
228
-
229
-
230
-
231
-
232
-
233
-
234
-
235
-
236
-
237
-
238
-
239
-
240
-
241
-
242
-
243
-
244
-
245
-
246
-
247
-
248
-
249
-
250
-
251
-
252
-
253
-
254
-
255
-
256
-
257
 |
 |

57
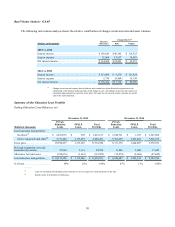
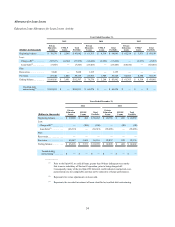
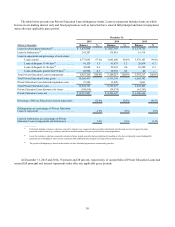
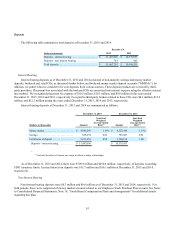
The following table summarizes changes in the allowance for Private Education Loan losses.
Years Ended December 31,
(Dollars in thousands) 2015 2014 2013 2012 2011
Allowance at beginning of period . . . . . . . . . . . . . . . . . . $ 78,574 $ 61,763 $ 65,218 $ 69,090 $ 49,738
Provision for Private Education Loan losses. . . . . . . . . . 87,344 83,583 64,955 62,447 85,037
Net charge-offs:
Charge-offs(1) . . . . . . . . . . . . . . . . . . . . . . . . . . . . . . . . (55,357) (14,442) — — —
Recoveries. . . . . . . . . . . . . . . . . . . . . . . . . . . . . . . . . . . 5,820 1,155 — — —
Net charge-offs . . . . . . . . . . . . . . . . . . . . . . . . . . . . . . . . (49,537) (13,287) — — —
Loan sales(2) . . . . . . . . . . . . . . . . . . . . . . . . . . . . . . . . . . . (7,565) (53,485) (68,410) (66,319) (65,685)
Allowance at end of period . . . . . . . . . . . . . . . . . . . . . . . $ 108,816 $ 78,574 $ 61,763 $ 65,218 $ 69,090
Allowance as a percentage of ending total loans. . . . . . . 1.03% 0.95% 0.94% 1.18% 1.34%
Allowance as a percentage of ending total loans in
repayment(3) . . . . . . . . . . . . . . . . . . . . . . . . . . . . . . . . . . . 1.57% 1.53% 1.55% 1.74% 1.63%
Allowance coverage of net charge-offs. . . . . . . . . . . . . . 2.20 5.91 - - -
Net charge-offs as a percentage of average loans in
repayment(3) . . . . . . . . . . . . . . . . . . . . . . . . . . . . . . . . . . . 0.82% 0.30% - - -
Delinquencies as a percentage of ending loans in
repayment . . . . . . . . . . . . . . . . . . . . . . . . . . . . . . . . . . . . 2.23% 2.01% 0.99% 1.19% 1.70%
Loans in forbearances as a percentage of ending loans
in repayment and forbearance . . . . . . . . . . . . . . . . . . . . . 3.36% 2.56% 0.41% 0.24% 0.10%
Percentage of loans with a cosigner. . . . . . . . . . . . . . . . . 89.80% 89.82% 89.87% 89.81% 88.84%
Average FICO at origination . . . . . . . . . . . . . . . . . . . . . . 748 749 745 746 748
Ending total loans, gross . . . . . . . . . . . . . . . . . . . . . . . . . $10,596,437 $ 8,311,376 $ 6,563,342 $ 5,507,908 $ 5,172,369
Average loans in repayment(3) . . . . . . . . . . . . . . . . . . . . . $ 6,031,741 $ 4,495,709 $ 3,509,502 $ 3,928,692 $ 3,832,531
Ending loans in repayment(3) . . . . . . . . . . . . . . . . . . . . . . $ 6,927,266 $ 5,149,215 $ 3,972,317 $ 3,750,223 $ 4,249,703
_______
(1) Prior to the Spin-Off, we sold all loans greater than 90 days delinquent to an entity that is now a subsidiary of Navient Corporation, prior to being
charged-off. Consequently, many of the pre-Spin-Off, historical credit indicators and period-over-period trends are not comparable and may not be
indicative of future performance.
(2) Represents fair value adjustments on loans sold.
(3) Loans in repayment include loans on which borrowers are making interest only and fixed payments as well as loans that have entered full principal and interest
repayment status.
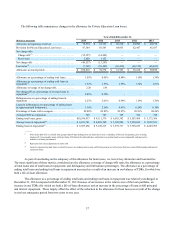
As part of concluding on the adequacy of the allowance for loan losses, we review key allowance and loan metrics.
The most significant of these metrics considered are the allowance coverage of charge-offs ratio; the allowance as a percentage
of total loans and of total loans in repayment; and delinquency and forbearance percentages. The allowance as a percentage of
ending total loans and ending total loans in repayment increased as a result of an increase in our balance of TDRs, for which we
hold a life-of-loan allowance.
The allowance as a percentage of ending total loans and ending total loans in repayment was relatively unchanged at
December 31, 2014 compared with December 31, 2013 because of an increase in the relative size of the loan portfolio, an
increase in our TDRs (for which we hold a life-of-loan allowance) and an increase in the percentage of loans in full principal
and interest repayment. These largely offset the effect of the reduction in the allowance for loan losses as a result of the change
in our loss emergence period from two years to one year.