Sallie Mae 2015 Annual Report Download - page 148
Download and view the complete annual report
Please find page 148 of the 2015 Sallie Mae annual report below. You can navigate through the pages in the report by either clicking on the pages listed below, or by using the keyword search tool below to find specific information within the annual report.-
 1
1 -
2
-
3
-
4
-
5
-
6
-
7
-
8
-
9
-
10
-
11
-
12
-
13
-
14
-
15
-
16
-
17
-
18
-
19
-
20
-
21
-
22
-
23
-
24
-
25
-
26
-
27
-
28
-
29
-
30
-
31
-
32
-
33
-
34
-
35
-
36
-
37
-
38
-
39
-
40
-
41
-
42
-
43
-
44
-
45
-
46
-
47
-
48
-
49
-
50
-
51
-
52
-
53
-
54
-
55
-
56
-
57
-
58
-
59
-
60
-
61
-
62
-
63
-
64
-
65
-
66
-
67
-
68
-
69
-
70
-
71
-
72
-
73
-
74
-
75
-
76
-
77
-
78
-
79
-
80
-
81
-
82
-
83
-
84
-
85
-
86
-
87
-
88
-
89
-
90
-
91
-
92
-
93
-
94
-
95
-
96
-
97
-
98
-
99
-
100
-
101
-
102
-
103
-
104
-
105
-
106
-
107
-
108
-
109
-
110
-
111
-
112
-
113
-
114
-
115
-
116
-
117
-
118
-
119
-
120
-
121
-
122
-
123
-
124
-
125
-
126
-
127
-
128
-
129
-
130
-
131
-
132
-
133
-
134
-
135
-
136
-
137
-
 138
138 -
 139
139 -
 140
140 -
 141
141 -
 142
142 -
 143
143 -
 144
144 -
 145
145 -
 146
146 -
 147
147 -
 148
148 -
 149
149 -
 150
150 -
 151
151 -
 152
152 -
 153
153 -
 154
154 -
 155
155 -
 156
156 -
 157
157 -
 158
158 -
159
-
160
-
161
-
162
-
163
-
164
-
165
-
166
-
167
-
168
-
169
-
170
-
171
-
172
-
173
-
174
-
175
-
176
-
177
-
178
-
179
-
180
-
181
-
182
-
183
-
184
-
185
-
186
-
187
-
188
-
189
-
190
-
191
-
192
-
193
-
194
-
195
-
196
-
197
-
198
-
199
-
200
-
201
-
202
-
203
-
204
-
205
-
206
-
207
-
208
-
209
-
210
-
211
-
212
-
213
-
214
-
215
-
216
-
217
-
218
-
219
-
220
-
221
-
222
-
223
-
224
-
225
-
226
-
227
-
228
-
229
-
230
-
231
-
232
-
233
-
234
-
235
-
236
-
237
-
238
-
239
-
240
-
241
-
242
-
243
-
244
-
245
-
246
-
247
-
248
-
249
-
250
-
251
-
252
-
253
-
254
-
255
-
256
-
257
 |
 |
SLM CORPORATION
NOTES TO CONSOLIDATED FINANCIAL STATEMENTS (Continued)
(Dollars in thousands, unless otherwise noted)
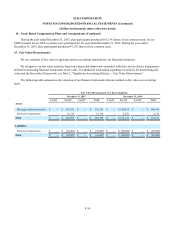
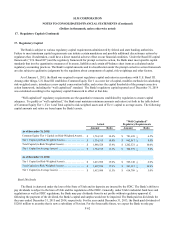
15. Fair Value Measurements (Continued)
F-58
Loans Held For Investment
Our Private Education Loans and FFELP Loans are accounted for at cost or at the lower of cost or market if the loan is
held-for-sale. For both Private Education Loans and FFELP Loans, fair value was determined by modeling expected loan level
cash flows using stated terms of the assets and internally developed assumptions to determine aggregate portfolio yield, net
present value and average life. The significant assumptions used to determine fair value are prepayment speeds, default rates,
cost of funds and required return on equity. Significant inputs into the model are not observable. However, we do calibrate the
model based on market transactions when appropriate. As such, these are level 3 valuations.
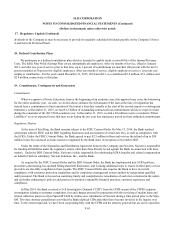
Accrued Interest Receivable
Accrued interest receivable is carried at cost. The carrying value approximates fair value due to its short-term nature. This
is a level 1 valuation.
Tax Indemnification Receivable
Tax indemnification receivable is carried at cost. The carrying value approximates fair value. This is a level 1 valuation.
Money Market and Savings Accounts
The fair value of money market and savings accounts equal the amounts payable on demand at the balance sheet date and
are reported at their carrying value. These are level 1 valuations.
Certificates of Deposit
The fair value of CDs are estimated using discounted cash flows based on rates currently offered for deposits of similar
remaining maturities. These are level 2 valuations.
Accrued Interest Payable
Accrued interest payable is carried at cost. The carrying value approximates fair value due to its short-term nature. This is
a level 1 valuation.
Borrowings
Borrowings are accounted for at cost in the consolidated financial statements. The carrying value of short-term
borrowings approximated fair value for disclosure purposes, due to the short-term nature of those borrowings. This is a level 1
valuation. The fair value of long-term borrowings is estimated using current market prices. This is a level 2 valuation.
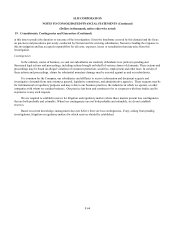
Derivatives
All derivatives are accounted for at fair value in the consolidated financial statements. The fair value of derivative
financial instruments was determined by a standard derivative pricing and option model using the stated terms of the contracts
and observable market inputs. It is our policy to compare the derivative fair values to those received from our counterparties in
order to evaluate the model’s outputs.
When determining the fair value of derivatives, we take into account counterparty credit risk for positions where we are
exposed to the counterparty on a net basis by assessing exposure net of collateral held. When the counterparty has exposure to
us under derivative contracts with the Company, we fully collateralize the exposure (subject to certain thresholds).
Interest rate swaps are valued using a standard derivative cash flow model with a LIBOR swap yield curve, which is an
observable input from an active market. These derivatives are level 2 fair value estimates in the hierarchy.