Sallie Mae 2015 Annual Report Download - page 10
Download and view the complete annual report
Please find page 10 of the 2015 Sallie Mae annual report below. You can navigate through the pages in the report by either clicking on the pages listed below, or by using the keyword search tool below to find specific information within the annual report.-
 1
1 -
 2
2 -
 3
3 -
 4
4 -
 5
5 -
 6
6 -
 7
7 -
 8
8 -
 9
9 -
 10
10 -
 11
11 -
 12
12 -
 13
13 -
 14
14 -
 15
15 -
 16
16 -
 17
17 -
 18
18 -
 19
19 -
 20
20 -
 21
21 -
22
-
23
-
24
-
25
-
26
-
27
-
28
-
29
-
30
-
31
-
32
-
33
-
34
-
35
-
36
-
37
-
38
-
39
-
40
-
41
-
42
-
43
-
44
-
45
-
46
-
47
-
48
-
49
-
50
-
51
-
52
-
53
-
54
-
55
-
56
-
57
-
58
-
59
-
60
-
61
-
62
-
63
-
64
-
65
-
66
-
67
-
68
-
69
-
70
-
71
-
72
-
73
-
74
-
75
-
76
-
77
-
78
-
79
-
80
-
81
-
82
-
83
-
84
-
85
-
86
-
87
-
88
-
89
-
90
-
91
-
92
-
93
-
94
-
95
-
96
-
97
-
98
-
99
-
100
-
101
-
102
-
103
-
104
-
105
-
106
-
107
-
108
-
109
-
110
-
111
-
112
-
113
-
114
-
115
-
116
-
117
-
118
-
119
-
120
-
121
-
122
-
123
-
124
-
125
-
126
-
127
-
128
-
129
-
130
-
131
-
132
-
133
-
134
-
135
-
136
-
137
-
138
-
139
-
140
-
141
-
142
-
143
-
144
-
145
-
146
-
147
-
148
-
149
-
150
-
151
-
152
-
153
-
154
-
155
-
156
-
157
-
158
-
159
-
160
-
161
-
162
-
163
-
164
-
165
-
166
-
167
-
168
-
169
-
170
-
171
-
172
-
173
-
174
-
175
-
176
-
177
-
178
-
179
-
180
-
181
-
182
-
183
-
184
-
185
-
186
-
187
-
188
-
189
-
190
-
191
-
192
-
193
-
194
-
195
-
196
-
197
-
198
-
199
-
200
-
201
-
202
-
203
-
204
-
205
-
206
-
207
-
208
-
209
-
210
-
211
-
212
-
213
-
214
-
215
-
216
-
217
-
218
-
219
-
220
-
221
-
222
-
223
-
224
-
225
-
226
-
227
-
228
-
229
-
230
-
231
-
232
-
233
-
234
-
235
-
236
-
237
-
238
-
239
-
240
-
241
-
242
-
243
-
244
-
245
-
246
-
247
-
248
-
249
-
250
-
251
-
252
-
253
-
254
-
255
-
256
-
257
 |
 |
8
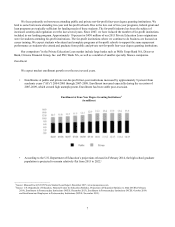
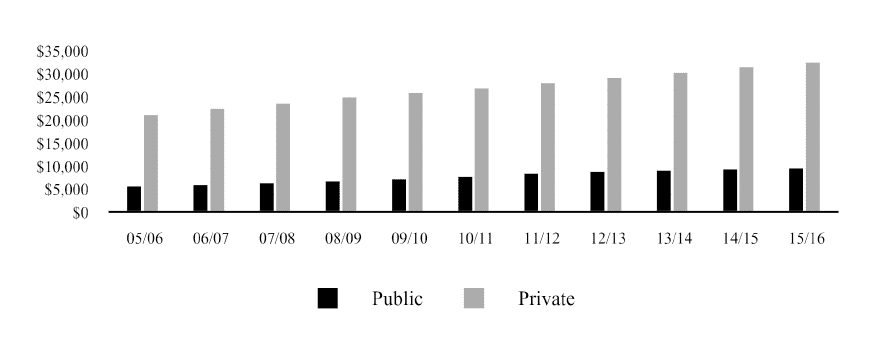
Tuition Rates
• Average published tuition and fees (exclusive of room and board) at four-year public and private not-for-profit
institutions increased at compound annual growth rates of 5.5 percent and 4.4 percent, respectively, from AYs
2005-2006 through 2015-2016. Growth rates have been more modest the last two AYs, with average published tuition
and fees at public and private four-year not-for-profit institutions increasing 2.9 percent and 3.8 percent, respectively,
between AYs 2013-2014 and 2014-2015 and 2.9 percent and 3.6 percent, respectively, between AYs 2014-2015 and
2015-2016.3 Tuition and fees are likely to continue to grow at the more modest rates of recent years.
Published Tuition and Fees3
(Dollars in actuals)
______
3 Source: The College Board-Trends in College Pricing 2015. © 2015 The College Board.
www.collegeboard.org. The College Board restates its data annually, which may cause
previously reported results to vary.
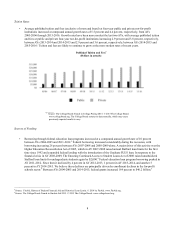
Sources of Funding
• Borrowing through federal education loan programs increased at a compound annual growth rate of 10 percent
between AYs 2004-2005 and 2011-2012.6 Federal borrowing increased considerably during the recession, with
borrowing increasing 26 percent between AYs 2007-2008 and 2008-2009 alone. A major driver of this activity was the
Higher Education Reconciliation Act of 2005, which in AY 2007-2008 raised annual Stafford loan limits for the first
time since 1992 and expanded federal lending with the introduction of the Graduate PLUS loan. In response to the
financial crisis in AY 2008-2009, The Ensuring Continued Access to Student Loans Act of 2008 raised unsubsidized
Stafford loan limits for undergraduate students again by $2,000.4 Federal education loan program borrowing peaked in
AY 2011-2012. Since then it declined by 4 percent in AY 2012-2013, 1 percent in AY 2013-2014, and another 5
percent in AY 2014-2015. We believe these declines are principally driven by enrollment declines in the for-profit
schools sector.4 Between AYs 2004-2005 and 2014-2015, federal grants increased 164 percent to $46.2 billion.5
_________________________
4 Source: FinAid, History of Student Financial Aid and Historical Loan Limits. © 2014 by FinAid. www.FinAid.org.
5 Source: The College Board-Trends in Student Aid 2015. © 2015 The College Board. www.collegeboard.org.