Sallie Mae 2015 Annual Report Download - page 128
Download and view the complete annual report
Please find page 128 of the 2015 Sallie Mae annual report below. You can navigate through the pages in the report by either clicking on the pages listed below, or by using the keyword search tool below to find specific information within the annual report.-
 1
1 -
2
-
3
-
4
-
5
-
6
-
7
-
8
-
9
-
10
-
11
-
12
-
13
-
14
-
15
-
16
-
17
-
18
-
19
-
20
-
21
-
22
-
23
-
24
-
25
-
26
-
27
-
28
-
29
-
30
-
31
-
32
-
33
-
34
-
35
-
36
-
37
-
38
-
39
-
40
-
41
-
42
-
43
-
44
-
45
-
46
-
47
-
48
-
49
-
50
-
51
-
52
-
53
-
54
-
55
-
56
-
57
-
58
-
59
-
60
-
61
-
62
-
63
-
64
-
65
-
66
-
67
-
68
-
69
-
70
-
71
-
72
-
73
-
74
-
75
-
76
-
77
-
78
-
79
-
80
-
81
-
82
-
83
-
84
-
85
-
86
-
87
-
88
-
89
-
90
-
91
-
92
-
93
-
94
-
95
-
96
-
97
-
98
-
99
-
100
-
101
-
102
-
103
-
104
-
105
-
106
-
107
-
108
-
109
-
110
-
111
-
112
-
113
-
114
-
115
-
116
-
117
-
 118
118 -
 119
119 -
 120
120 -
 121
121 -
 122
122 -
 123
123 -
 124
124 -
 125
125 -
 126
126 -
 127
127 -
 128
128 -
 129
129 -
 130
130 -
 131
131 -
 132
132 -
 133
133 -
 134
134 -
 135
135 -
 136
136 -
 137
137 -
 138
138 -
139
-
140
-
141
-
142
-
143
-
144
-
145
-
146
-
147
-
148
-
149
-
150
-
151
-
152
-
153
-
154
-
155
-
156
-
157
-
158
-
159
-
160
-
161
-
162
-
163
-
164
-
165
-
166
-
167
-
168
-
169
-
170
-
171
-
172
-
173
-
174
-
175
-
176
-
177
-
178
-
179
-
180
-
181
-
182
-
183
-
184
-
185
-
186
-
187
-
188
-
189
-
190
-
191
-
192
-
193
-
194
-
195
-
196
-
197
-
198
-
199
-
200
-
201
-
202
-
203
-
204
-
205
-
206
-
207
-
208
-
209
-
210
-
211
-
212
-
213
-
214
-
215
-
216
-
217
-
218
-
219
-
220
-
221
-
222
-
223
-
224
-
225
-
226
-
227
-
228
-
229
-
230
-
231
-
232
-
233
-
234
-
235
-
236
-
237
-
238
-
239
-
240
-
241
-
242
-
243
-
244
-
245
-
246
-
247
-
248
-
249
-
250
-
251
-
252
-
253
-
254
-
255
-
256
-
257
 |
 |

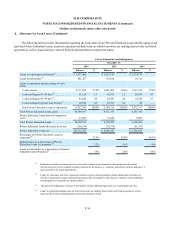
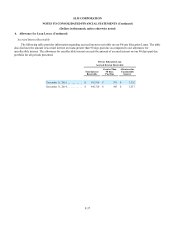
SLM CORPORATION
NOTES TO CONSOLIDATED FINANCIAL STATEMENTS (Continued)
(Dollars in thousands, unless otherwise noted)
F-38
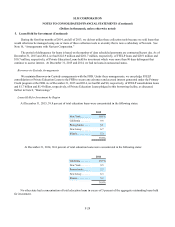
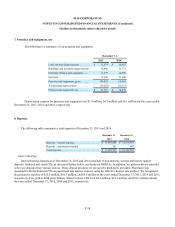
7. Premises and equipment, net
The following is a summary of our premises and equipment.
December 31,
2015 2014
Land and land improvements . . . . . . . . $ 12,574 $ 10,927
Buildings and leasehold improvements.56,446 56,772
Furniture, fixtures and equipment . . . . . 12,275 10,898
Software. . . . . . . . . . . . . . . . . . . . . . . . . 39,530 31,988
Premises and equipment, gross . . . . . . . 120,825 110,585
Accumulated depreciation. . . . . . . . . . . (39,552) (32,115)
Premises and equipment, net. . . . . . . . . $ 81,273 $ 78,470
Depreciation expense for premises and equipment was $7.4 million, $6.1 million and $5.1 million for the years ended
December 31, 2015, 2014 and 2013, respectively.
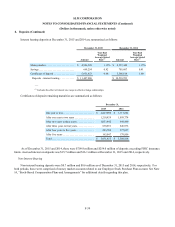
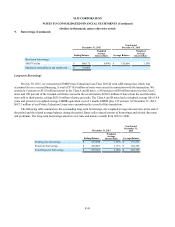
8. Deposits
The following table summarizes total deposits at December 31, 2015 and 2014.
December 31, December 31,
2015 2014
Deposits - interest bearing . . . . . . . . . . . . . . . . . . . . $ 11,487,006 $ 10,539,953
Deposits - non-interest bearing . . . . . . . . . . . . . . . . 701 602
Total deposits. . . . . . . . . . . . . . . . . . . . . . . . . . . . . . $ 11,487,707 $ 10,540,555
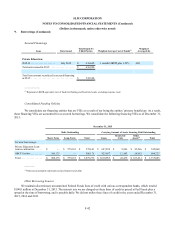
Interest Bearing
Interest bearing deposits as of December 31, 2015 and 2014 consisted of non-maturity savings and money market
deposits, brokered and retail CDs, as discussed further below, and brokered MMDAs. In addition, we gather what we consider
to be core deposits from various sources. These deposit products are serviced by third-party providers. Placement fees
associated with the brokered CDs are amortized into interest expense using the effective interest rate method. We recognized
placement fee expense of $10.5 million, $10.3 million, and $9.8 million in the years ended December 31, 2015, 2014 and 2013,
respectively. Fees paid to third-party brokers related to these CDs were $4.1 million, $15.2 million, and $12.1 million during
the years ended December 31, 2015, 2014 and 2013, respectively.