Sallie Mae 2015 Annual Report Download - page 147
Download and view the complete annual report
Please find page 147 of the 2015 Sallie Mae annual report below. You can navigate through the pages in the report by either clicking on the pages listed below, or by using the keyword search tool below to find specific information within the annual report.-
 1
1 -
2
-
3
-
4
-
5
-
6
-
7
-
8
-
9
-
10
-
11
-
12
-
13
-
14
-
15
-
16
-
17
-
18
-
19
-
20
-
21
-
22
-
23
-
24
-
25
-
26
-
27
-
28
-
29
-
30
-
31
-
32
-
33
-
34
-
35
-
36
-
37
-
38
-
39
-
40
-
41
-
42
-
43
-
44
-
45
-
46
-
47
-
48
-
49
-
50
-
51
-
52
-
53
-
54
-
55
-
56
-
57
-
58
-
59
-
60
-
61
-
62
-
63
-
64
-
65
-
66
-
67
-
68
-
69
-
70
-
71
-
72
-
73
-
74
-
75
-
76
-
77
-
78
-
79
-
80
-
81
-
82
-
83
-
84
-
85
-
86
-
87
-
88
-
89
-
90
-
91
-
92
-
93
-
94
-
95
-
96
-
97
-
98
-
99
-
100
-
101
-
102
-
103
-
104
-
105
-
106
-
107
-
108
-
109
-
110
-
111
-
112
-
113
-
114
-
115
-
116
-
117
-
118
-
119
-
120
-
121
-
122
-
123
-
124
-
125
-
126
-
127
-
128
-
129
-
130
-
131
-
132
-
133
-
134
-
135
-
136
-
 137
137 -
 138
138 -
 139
139 -
 140
140 -
 141
141 -
 142
142 -
 143
143 -
 144
144 -
 145
145 -
 146
146 -
 147
147 -
 148
148 -
 149
149 -
 150
150 -
 151
151 -
 152
152 -
 153
153 -
 154
154 -
 155
155 -
 156
156 -
 157
157 -
158
-
159
-
160
-
161
-
162
-
163
-
164
-
165
-
166
-
167
-
168
-
169
-
170
-
171
-
172
-
173
-
174
-
175
-
176
-
177
-
178
-
179
-
180
-
181
-
182
-
183
-
184
-
185
-
186
-
187
-
188
-
189
-
190
-
191
-
192
-
193
-
194
-
195
-
196
-
197
-
198
-
199
-
200
-
201
-
202
-
203
-
204
-
205
-
206
-
207
-
208
-
209
-
210
-
211
-
212
-
213
-
214
-
215
-
216
-
217
-
218
-
219
-
220
-
221
-
222
-
223
-
224
-
225
-
226
-
227
-
228
-
229
-
230
-
231
-
232
-
233
-
234
-
235
-
236
-
237
-
238
-
239
-
240
-
241
-
242
-
243
-
244
-
245
-
246
-
247
-
248
-
249
-
250
-
251
-
252
-
253
-
254
-
255
-
256
-
257
 |
 |
SLM CORPORATION
NOTES TO CONSOLIDATED FINANCIAL STATEMENTS (Continued)
(Dollars in thousands, unless otherwise noted)
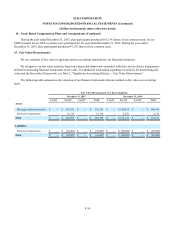
15. Fair Value Measurements (Continued)
F-57
The following table summarizes the fair values of our financial assets and liabilities, including derivative financial
instruments.
December 31, 2015 December 31, 2014
Fair
Value Carrying
Value Difference Fair
Value Carrying
Value Difference
Earning assets
Loans held for investment, net . . . . . $ 12,343,726 $ 11,630,591 $ 713,135 $10,228,399 $ 9,509,786 $ 718,613
Cash and cash equivalents . . . . . . . . 2,416,219 2,416,219 — 2,359,780 2,359,780 —
Available for sale investments . . . . . 195,391 195,391 — 168,934 168,934 —
Accrued interest receivable . . . . . . . 564,496 564,496 — 469,697 469,697 —
Tax indemnification receivable . . . . 186,076 186,076 — 240,311 240,311 —
Derivative instruments . . . . . . . . . . . 15,314 15,314 — 5,238 5,238 —
Total earning assets. . . . . . . . . . . . . . $ 15,721,222 $ 15,008,087 $ 713,135 $13,472,359 $ 12,753,746 $ 718,613
Interest-bearing liabilities
Money-market and savings accounts $ 5,556,254 $ 5,556,254 $ — $ 5,231,736 $ 5,231,736 $ —
Certificates of deposit. . . . . . . . . . . . 5,928,450 5,931,453 3,003 5,313,645 5,308,818 (4,827)
Short-term borrowings . . . . . . . . . . . 500,175 500,175 — — — —
Long-term borrowings . . . . . . . . . . . 567,468 579,101 11,633 — — —
Accrued interest payable . . . . . . . . . 16,385 16,385 — 16,082 16,082 —
Derivative instruments . . . . . . . . . . . 30,497 30,497 — 28,688 28,688 —
Total interest-bearing liabilities . . . . $ 12,599,229 $ 12,613,865 14,636 $10,590,151 $ 10,585,324 $ (4,827)
Excess of net asset fair value over
carrying value . . . . . . . . . . . . . . . . . $ 727,771 $ 713,786
The methods and assumptions used to estimate the fair value of each class of financial instruments are as follows:
Cash and Cash Equivalents
Cash and cash equivalents are carried at cost. Carrying value approximated fair value for disclosure purposes. These are
level 1 valuations.
Investments
Investments are classified as available-for-sale and are carried at fair value in the consolidated financial statements.
Investments in mortgage-backed securities are valued using observable market prices of similar assets. As such, these are level
2 valuations.