Sallie Mae 2015 Annual Report Download - page 81
Download and view the complete annual report
Please find page 81 of the 2015 Sallie Mae annual report below. You can navigate through the pages in the report by either clicking on the pages listed below, or by using the keyword search tool below to find specific information within the annual report.-
 1
1 -
2
-
3
-
4
-
5
-
6
-
7
-
8
-
9
-
10
-
11
-
12
-
13
-
14
-
15
-
16
-
17
-
18
-
19
-
20
-
21
-
22
-
23
-
24
-
25
-
26
-
27
-
28
-
29
-
30
-
31
-
32
-
33
-
34
-
35
-
36
-
37
-
38
-
39
-
40
-
41
-
42
-
43
-
44
-
45
-
46
-
47
-
48
-
49
-
50
-
51
-
52
-
53
-
54
-
55
-
56
-
57
-
58
-
59
-
60
-
61
-
62
-
63
-
64
-
65
-
66
-
67
-
68
-
69
-
70
-
 71
71 -
 72
72 -
 73
73 -
 74
74 -
 75
75 -
 76
76 -
 77
77 -
 78
78 -
 79
79 -
 80
80 -
 81
81 -
 82
82 -
 83
83 -
 84
84 -
 85
85 -
 86
86 -
 87
87 -
 88
88 -
 89
89 -
 90
90 -
 91
91 -
92
-
93
-
94
-
95
-
96
-
97
-
98
-
99
-
100
-
101
-
102
-
103
-
104
-
105
-
106
-
107
-
108
-
109
-
110
-
111
-
112
-
113
-
114
-
115
-
116
-
117
-
118
-
119
-
120
-
121
-
122
-
123
-
124
-
125
-
126
-
127
-
128
-
129
-
130
-
131
-
132
-
133
-
134
-
135
-
136
-
137
-
138
-
139
-
140
-
141
-
142
-
143
-
144
-
145
-
146
-
147
-
148
-
149
-
150
-
151
-
152
-
153
-
154
-
155
-
156
-
157
-
158
-
159
-
160
-
161
-
162
-
163
-
164
-
165
-
166
-
167
-
168
-
169
-
170
-
171
-
172
-
173
-
174
-
175
-
176
-
177
-
178
-
179
-
180
-
181
-
182
-
183
-
184
-
185
-
186
-
187
-
188
-
189
-
190
-
191
-
192
-
193
-
194
-
195
-
196
-
197
-
198
-
199
-
200
-
201
-
202
-
203
-
204
-
205
-
206
-
207
-
208
-
209
-
210
-
211
-
212
-
213
-
214
-
215
-
216
-
217
-
218
-
219
-
220
-
221
-
222
-
223
-
224
-
225
-
226
-
227
-
228
-
229
-
230
-
231
-
232
-
233
-
234
-
235
-
236
-
237
-
238
-
239
-
240
-
241
-
242
-
243
-
244
-
245
-
246
-
247
-
248
-
249
-
250
-
251
-
252
-
253
-
254
-
255
-
256
-
257
 |
 |

79
monitored and modeled to ensure that the interest rate risk does not cause the organization to exceed its policy limits for
earnings at risk or for the value of equity at risk.
In the preceding tables, the interest rate sensitivity analysis reflects the heavy balance sheet mix of fully variable LIBOR-
based loans, which exceeds the mix of fully variable funding, which in turn includes brokered CDs that have been converted to
LIBOR through derivative transactions. The analysis does not anticipate that retail MMDAs or retail savings balances, while
relatively sensitive to interest rate changes, will reprice to the full extent of interest rate shocks or ramps. Partially offsetting this
asset sensitive position, is (i) the impact of FFELP loans, which receive Floor Income in low interest rate environments, and
will therefore not reprice fully with interest rate shocks and (ii) the impact of a portion of our fixed-rate loans that have not been
fully match-funded through derivative transactions and fixed-rate funding from asset securitization. The overall slightly asset-
sensitive position will generally cause net interest income to increase somewhat when interest rates rise.
Although we believe that these measurements provide an estimate of our interest rate sensitivity, they do not account for
potential changes in credit quality, balance sheet mix and size of our balance sheet. They also do not account for other business
developments that could affect net income, or for management actions that could affect net income or could be taken to change
our risk profile. Accordingly, we can give no assurance that actual results would not differ materially from the estimated
outcomes of our simulations. Further, such simulations do not represent our current view of expected future interest rate
movements.
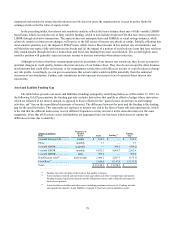
Asset and Liability Funding Gap
The table below presents our assets and liabilities (funding) arranged by underlying indices as of December 31, 2015. In
the following GAAP presentation, the funding gap only includes derivatives that qualify as effective hedges (those derivatives
which are reflected in net interest margin, as opposed to those reflected in the “gains (losses) on derivatives and hedging
activities, net” line on the consolidated statements of income). The difference between the asset and the funding is the funding
gap for the specified index. This represents our exposure to interest rate risk in the form of basis risk and repricing risk, which
is the risk that the different indices may reset at different frequencies or may not move in the same direction or at the same
magnitude. (Note that all fixed-rate assets and liabilities are aggregated into one line item, which does not capture the
differences in time due to maturity.)
(Dollars in millions)
Index
Frequency of
Variable
Resets Assets Funding (1) Funding
Gap
3-month Treasury bill. . . . . . weekly $ 162.1 $ — $ 162.1
Prime. . . . . . . . . . . . . . . . . . . monthly 7.7 — 7.7
3-month LIBOR . . . . . . . . . . quarterly — 399.2 (399.2)
1-month LIBOR . . . . . . . . . . monthly 8,632.1 6,069.7 2,562.4
1-month LIBOR . . . . . . . . . . daily 953.6 — 953.6
Non-Discrete reset(2) . . . . . . . daily/weekly 2,444.2 2,597.3 (153.1)
Fixed Rate(3) . . . . . . . . . . . . . 3,014.4 6,147.9 (3,133.5)
Total . . . . . . . . . . . . . . . . . . . $ 15,214.1 $ 15,214.1 $ —
______________________
(1) Funding (by index) includes all derivatives that qualify as hedges.
(2) Assets include restricted and unrestricted cash equivalents and other overnight type instruments.
Funding includes liquid retail deposits and the obligation to return cash collateral held related to
derivatives exposures.
(3) Assets include receivables and other assets (including premiums and reserves). Funding includes
unswapped time deposits, liquid MMDA's swapped to fixed rates and stockholders' equity.