Sallie Mae 2015 Annual Report Download - page 116
Download and view the complete annual report
Please find page 116 of the 2015 Sallie Mae annual report below. You can navigate through the pages in the report by either clicking on the pages listed below, or by using the keyword search tool below to find specific information within the annual report.-
 1
1 -
2
-
3
-
4
-
5
-
6
-
7
-
8
-
9
-
10
-
11
-
12
-
13
-
14
-
15
-
16
-
17
-
18
-
19
-
20
-
21
-
22
-
23
-
24
-
25
-
26
-
27
-
28
-
29
-
30
-
31
-
32
-
33
-
34
-
35
-
36
-
37
-
38
-
39
-
40
-
41
-
42
-
43
-
44
-
45
-
46
-
47
-
48
-
49
-
50
-
51
-
52
-
53
-
54
-
55
-
56
-
57
-
58
-
59
-
60
-
61
-
62
-
63
-
64
-
65
-
66
-
67
-
68
-
69
-
70
-
71
-
72
-
73
-
74
-
75
-
76
-
77
-
78
-
79
-
80
-
81
-
82
-
83
-
84
-
85
-
86
-
87
-
88
-
89
-
90
-
91
-
92
-
93
-
94
-
95
-
96
-
97
-
98
-
99
-
100
-
101
-
102
-
103
-
104
-
105
-
 106
106 -
 107
107 -
 108
108 -
 109
109 -
 110
110 -
 111
111 -
 112
112 -
 113
113 -
 114
114 -
 115
115 -
 116
116 -
 117
117 -
 118
118 -
 119
119 -
 120
120 -
 121
121 -
 122
122 -
 123
123 -
 124
124 -
 125
125 -
 126
126 -
127
-
128
-
129
-
130
-
131
-
132
-
133
-
134
-
135
-
136
-
137
-
138
-
139
-
140
-
141
-
142
-
143
-
144
-
145
-
146
-
147
-
148
-
149
-
150
-
151
-
152
-
153
-
154
-
155
-
156
-
157
-
158
-
159
-
160
-
161
-
162
-
163
-
164
-
165
-
166
-
167
-
168
-
169
-
170
-
171
-
172
-
173
-
174
-
175
-
176
-
177
-
178
-
179
-
180
-
181
-
182
-
183
-
184
-
185
-
186
-
187
-
188
-
189
-
190
-
191
-
192
-
193
-
194
-
195
-
196
-
197
-
198
-
199
-
200
-
201
-
202
-
203
-
204
-
205
-
206
-
207
-
208
-
209
-
210
-
211
-
212
-
213
-
214
-
215
-
216
-
217
-
218
-
219
-
220
-
221
-
222
-
223
-
224
-
225
-
226
-
227
-
228
-
229
-
230
-
231
-
232
-
233
-
234
-
235
-
236
-
237
-
238
-
239
-
240
-
241
-
242
-
243
-
244
-
245
-
246
-
247
-
248
-
249
-
250
-
251
-
252
-
253
-
254
-
255
-
256
-
257
 |
 |
SLM CORPORATION
NOTES TO CONSOLIDATED FINANCIAL STATEMENTS (Continued)
(Dollars in thousands, unless otherwise noted)
F-26
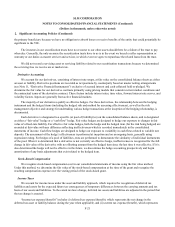
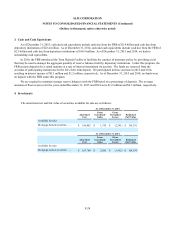
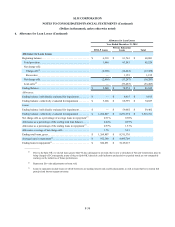
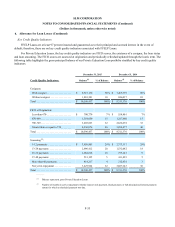
5. Loans Held for Investment
Loans Held for Investment consist of Private Education Loans and FFELP Loans.
Our Private Education Loans are made largely to bridge the gap between the cost of higher education and the amount
funded through financial aid, government loans and customers’ resources. Private Education Loans bear the full credit risk of
the customer. We manage this risk through risk-performance underwriting strategies and qualified cosigners. Private Education
Loans generally carry a variable rate indexed to LIBOR. As of December 31, 2015, 81 percent of all Private Education Loans
were indexed to LIBOR. We provide incentives for customers to include a cosigner on the loan, and the vast majority of loans
in our portfolio are cosigned. We also encourage customers to make payments while in school.
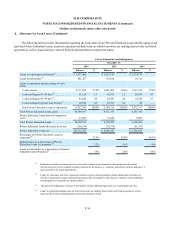
FFELP Loans are insured as to their principal and accrued interest in the event of default subject to a Risk Sharing level
based on the date of loan disbursement. These insurance obligations are supported by contractual rights against the United
States. For loans disbursed on or after July 1, 2006, we receive 97 percent reimbursement. For loans disbursed after October 1,
1993, and before July 1, 2006, we receive 98 percent reimbursement on all qualifying claims. For loans disbursed prior to
October 1, 1993, we receive 100 percent reimbursement.
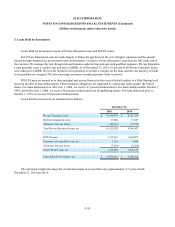
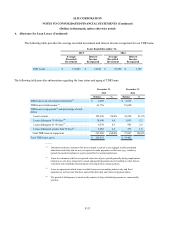
Loans held for investment are summarized as follows:
December 31,
2015 2014
Private Education Loans. . . . . . . . . . . . . . . . . . . . . . . $ 10,596,437 $ 8,311,376
Deferred origination costs. . . . . . . . . . . . . . . . . . . . . . 27,884 13,845
Allowance for loan losses. . . . . . . . . . . . . . . . . . . . . . (108,816) (78,574)
Total Private Education Loans, net. . . . . . . . . . . . . . . 10,515,505 8,246,647
FFELP Loans . . . . . . . . . . . . . . . . . . . . . . . . . . . . . . . 1,115,663 1,264,807
Unamortized acquisition costs, net. . . . . . . . . . . . . . . 3,114 3,600
Allowance for loan losses. . . . . . . . . . . . . . . . . . . . . . (3,691) (5,268)
Total FFELP Loans, net . . . . . . . . . . . . . . . . . . . . . . . 1,115,086 1,263,139
Loans held for investment, net . . . . . . . . . . . . . . . . . . $ 11,630,591 $ 9,509,786
The estimated weighted average life of education loans in our portfolio was approximately 6.2 years at both
December 31, 2015 and 2014.